

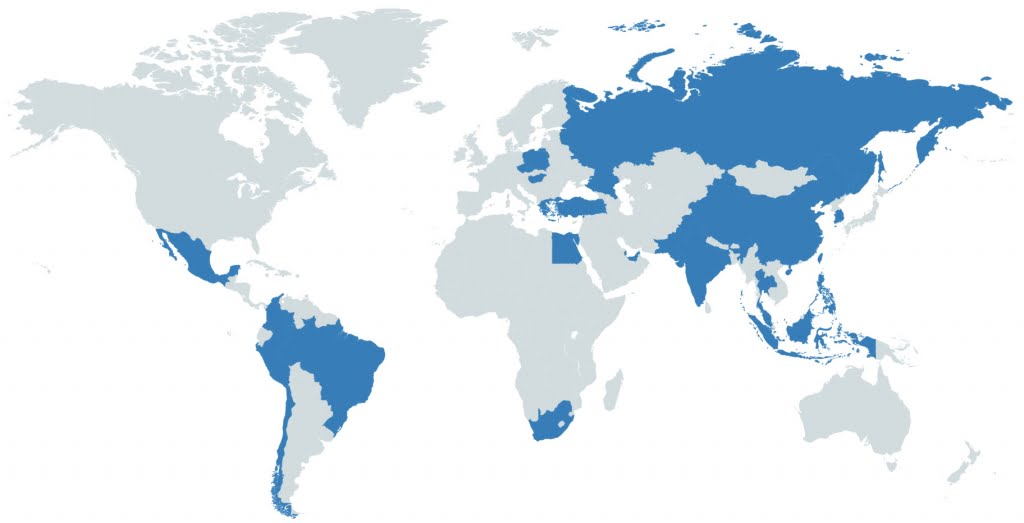
In the last three installments of my “Understanding ETFs” series, we toured the developed markets equity ETF landscape. Of course, when it comes to investing, you don’t have to limit yourself to developed countries. As you can see in the world view below, there’s a lot of turf to be covered by venturing into the blue-coloured emerging or developing markets.
Today, we’ll explore how to further diversify your portfolio by adding ETFs that invest in emerging stock markets around the globe.
The Emerging ETF Landscape
In 2003, BlackRock released the iShares MSCI Emerging Markets ETF (EEM). MSCI is an acronym for “Morgan Stanley Capital International”. EEM tracks the performance of over 1,000 large and mid-size companies located in 24 emerging countries around the world.
The “BRICS” countries – Brazil, Russia, India, China and South Africa – make up about 57% of the fund’s total country allocation.
Top 10 Countries by EEM Weight
| Country | Weight |
|---|---|
| China | 30.3% |
| Korea | 13.7% |
| Taiwan | 11.4% |
| India | 9.4% |
| Brazil | 7.5% |
| South Africa | 6.2% |
| Russia | 3.7% |
| Mexico | 2.8% |
| Thailand | 2.4% |
| Malaysia | 2.4% |
Source: BlackRock Inc., as of December 31, 2018
As EEM trades in U.S. dollars on the U.S. stock exchange, Canadian investors may find it more convenient to purchase the iShares MSCI Emerging Markets Index ETF (XEM) instead. XEM follows the same index, but trades in Canadian dollars on the Canadian stock exchange. However, its cost is relatively high, at 0.82% per year.
Investors may be better off purchasing the BMO MSCI Emerging Markets Index ETF (ZEM), which also trades on the Canadian stock exchange in Canadian dollars, but has an annual cost of just 0.27%. ZEM also holds about 85% of its stocks directly, making its structure slightly more tax-efficient than XEM.
| U.S.-Listed | Canadian-Listed |
|---|---|
| iShares MSCI Emerging Markets ETF (EEM) | - iShares MSCI Emerging Markets Index ETF (XEM) - BMO MSCI Emerging Markets Index ETF (ZEM) |
Each company in the MSCI Emerging Markets Index is weighted according to its “float-adjusted” market capitalization. For more information on float-adjusted market caps, please watch my video, Understanding Canadian Equity ETFs.
Engaging in Small Talk
In 2011, BlackRock also launched the iShares MSCI Emerging Markets Small-Cap ETF (EEMS). EEMS complements EEM by following the MSCI Emerging Markets Small Cap Index, which tracks the performance of over 1,500 smaller companies located in the emerging economies.
| Tracking ETF | Symbol | MER | Underlying Index | Number of Stocks | Dividend Yield |
|---|---|---|---|---|---|
| iShares MSCI Emerging Markets ETF | EEM | 0.69% | MSCI Emerging Markets Index | 1,125 | 2.9% |
| iShares MSCI Emerging Markets Small-Cap ETF | EEMS | 0.69% | MSCI Emerging Markets Small Cap Index | 1,587 | 2.9% |
Sources: BlackRock Inc., MSCI, as of December 31, 2018
By allocating about 89% of your EM equity investment dollars to EEM, and the remaining 11% to EEMS, you gain float-adjusted market-cap exposure to most emerging markets stocks, at an annual MER of about 0.69%.
If You Can’t Beat ’Em, Join EEM
As you may have already pieced together, there also is a single index that follows a combination of the MSCI Emerging Markets Index and the MSCI Emerging Markets Small Cap Index. It’s called the MSCI Emerging Markets IMI Index.
“IMI” stands for “Investable Market Index”, which includes large, mid-size and small-size companies. This index follows the performance of over 2,700 emerging companies, providing broad stock market exposure.
As you might expect from my previous videos, there are yet again ETFs available that track this more diversified index.
The iShares Core MSCI Emerging Markets ETF (IEMG) trades on the U.S. stock exchange in U.S. dollars. IEMG tracks over 2,700 emerging markets stocks and has a cost of 0.14% per year. In addition, its sister ETF, the iShares Core MSCI Emerging Markets IMI Index ETF (XEC), trades on the Canadian stock exchange in Canadian dollars.
| Tracking ETF | Symbol | MER | Underlying Index | Number of Stocks | Dividend Yield |
|---|---|---|---|---|---|
| iShares Core MSCI Emerging Markets ETF | IEMG | 0.14% | MSCI Emerging Markets IMI Index | 2,712 | 2.9% |
| iShares Core MSCI Emerging Markets IMI Index ETF | XEC | 0.26% | MSCI Emerging Markets IMI Index | 2,712 | 2.9% |
Sources: BlackRock Asset Management Canada Limited, BlackRock Inc., MSCI, as of December 31, 2018
XEC has an MER of 0.26%, and simply invests in its U.S.-listed counterpart ETF, IEMG, to gain exposure to emerging markets stocks. This wrap structure makes XEC less tax-efficient than IEMG when held in a tax-deferred account (such as an RRSP, LIRA, RRIF or LIF). This extra tax drag is due to the additional 15% U.S. withholding taxes that apply on foreign dividends paid to Canadian investors from the underlying U.S. fund. For more information on foreign withholding taxes, please refer to our white paper on the subject, but here’s a quick overview of their expected impact.
Estimated Unrecoverable Foreign Withholding Taxes: IEMG vs. XEC
| Account Type | iShares Core MSCI Emerging Markets ETF (IEMG) | iShares Core MSCI Emerging Markets IMI Index ETF (XEC) |
|---|---|---|
| Registered Retirement Savings Plan (RRSP) | 0.31% | 0.68% |
| Registered Retirement Income Fund (RRIF) | 0.31% | 0.68% |
| Locked-in Retirement Account (LIRA) | 0.31% | 0.68% |
| Life Income Fund (LIF) | 0.31% | 0.68% |
| Tax-Free Savings Account (TFSA) | 0.68% | 0.68% |
| Registered Education Savings Plan (RESP) | 0.68% | 0.68% |
| Registered Disability Savings Plan (RDSP) | 0.68% | 0.68% |
| Taxable Accounts | 0.31% | 0.31% |
Sources: BlackRock Asset Management Canada Limited, BlackRock Inc., MSCI, as of December 31, 2018
Driving My VWO
In 2005, Vanguard U.S. released the Vanguard FTSE Emerging Markets ETF (VWO). VWO follows the FTSE Emerging Markets All Cap China A Inclusion Index, which tracks the performance of over 4,000 companies located in 23 emerging countries around the globe. This makes it similar to IEMG. As discussed in earlier installments, “FTSE” stands for “Financial Times Stock Exchange”, and “All Cap” indicates that the index tracks large, mid-cap, and small-cap companies.
Before you get too excited about the 4,000 plus holdings in VWO, know that over 1,000 of these holdings are small cap China A shares, which currently account for less than 1% of the fund. I’ll discuss China A shares in more detail in an upcoming video.
In 2011, Vanguard Canada launched a Canadian-version of VWO, the Vanguard FTSE Emerging Markets All Cap Index ETF (VEE). VEE has an MER of 0.24%, and simply invests in its U.S.-listed counterpart, VWO, to gain exposure to emerging markets stocks. This wrap structure makes VEE less tax-efficient than VWO when held in a tax-deferred account (such as an RRSP, LIRA, RRIF and LIF). Again, we’ll show that below.
| Tracking ETF | Symbol | MER | Underlying Index | Number of Stocks | Dividend Yield |
|---|---|---|---|---|---|
| Vanguard FTSE Emerging Markets ETF | VWO | 0.14% | FTSE Emerging Markets All Cap China A Inclusion Index | 4,032 | 3.1% |
| Vanguard FTSE Emerging Markets All Cap Index ETF | VEE | 0.24% | FTSE Emerging Markets All Cap China A Inclusion Index | 4,032 | 3.1% |
Sources: The Vanguard Group, Inc., Vanguard Investments Canada Inc., FTSE Russell Indices, as of December 31, 2018
Estimated Unrecoverable Foreign Withholding Taxes: VWO vs. VEE
| Account Type | Vanguard FTSE Emerging Markets ETF (VWO) | Vanguard FTSE Emerging Markets All Cap Index ETF (VEE) |
|---|---|---|
| Registered Retirement Savings Plan (RRSP) | 0.31% | 0.71% |
| Registered Retirement Income Fund (RRIF) | 0.31% | 0.71% |
| Locked-in Retirement Account (LIRA) | 0.31% | 0.71% |
| Life Income Fund (LIF) | 0.31% | 0.71% |
| Tax-Free Savings Account (TFSA) | 0.71% | 0.71% |
| Registered Education Savings Plan (RESP) | 0.71% | 0.71% |
| Registered Disability Savings Plan (RDSP) | 0.71% | 0.71% |
| Taxable Accounts | 0.31% | 0.31% |
Sources: BlackRock Asset Management Canada Limited, BlackRock Inc., FTSE Russell Indices, MSCI, The Vanguard Group, Inc., Vanguard Investments Canada Inc. as of December 31, 2018
Define “Emerging”
There are a number of notable differences between the MSCI and FTSE emerging markets indices. Plus, the country classifications are in a constant state of flux. It’s probably best to consider emerging market investing as an even more inexact science than usual. At least at the moment, here are some of the variations on the theme:
• MSCI classifies Korea as an emerging market, so includes about 422 Korean companies in the MSCI Emerging Markets IMI Index. (As you’ll recall from my last video, FTSE classifies Korea as a developed country, and therefore includes about 418 Korean companies in the FTSE Developed All Cap ex North America Index instead.)
• MSCI classifies Poland as an emerging market, so includes about 37 Polish companies in the MSCI Emerging Markets IMI Index. FTSE classifies Poland as a developed market, so includes about 37 Polish companies in its FTSE Developed All Cap ex North America Index.
• MSCI classifies Kuwait as a frontier market, so excludes it from both its developed and emerging markets indices. FTSE considers Kuwait to be an emerging market, so includes about 13 companies of Kuwait in its FTSE Emerging Markets All Cap China A Inclusion Index.
• Both MSCI and FTSE include a portion of China A shares within their emerging markets indices. However, MSCI currently only includes about 234 large cap China A share companies, while FTSE includes around 1,915 large-, mid- and small-cap China A share companies.
Market Classification
| Country | FTSE | MSCI |
|---|---|---|
| Korea | Developed | Emerging |
| Poland | Developed | Emerging |
| Kuwait | Emerging | Frontier |
Sources: FTSE Russell Indices, MSCI, as of December 31, 2018
As shown in this chart, IEMG and XEC each currently allocate about 14% of their holdings to Korean stocks, while in turn underweighting many of their other top country holdings, relative to VWO and VEE.
Top Country Weights: IEMG/XEC vs. VWO/VEE
| Country | IEMG/XEC | VWO/VEE | Difference |
|---|---|---|---|
| China | 28.2% | 33.7% | -5.5% |
| Korea | 14.2% | - | +14.2% |
| Taiwan | 12.2% | 14.1% | -1.9% |
| India | 10.2% | 12.0% | -1.8% |
| Brazil | 7.3% | 8.5% | -1.2% |
| South Africa | 6.1% | 6.9% | -0.8% |
| Russia | 3.4% | 3.7% | -0.3% |
| Mexico | 2.8% | 3.2% | -0.4% |
| Thailand | 2.6% | 3.9% | -1.3% |
| Malaysia | 2.5% | 3.3% | -0.8% |
Sources: BlackRock Asset Management Canada Limited, Vanguard Investments Canada Inc., as of December 31, 2018
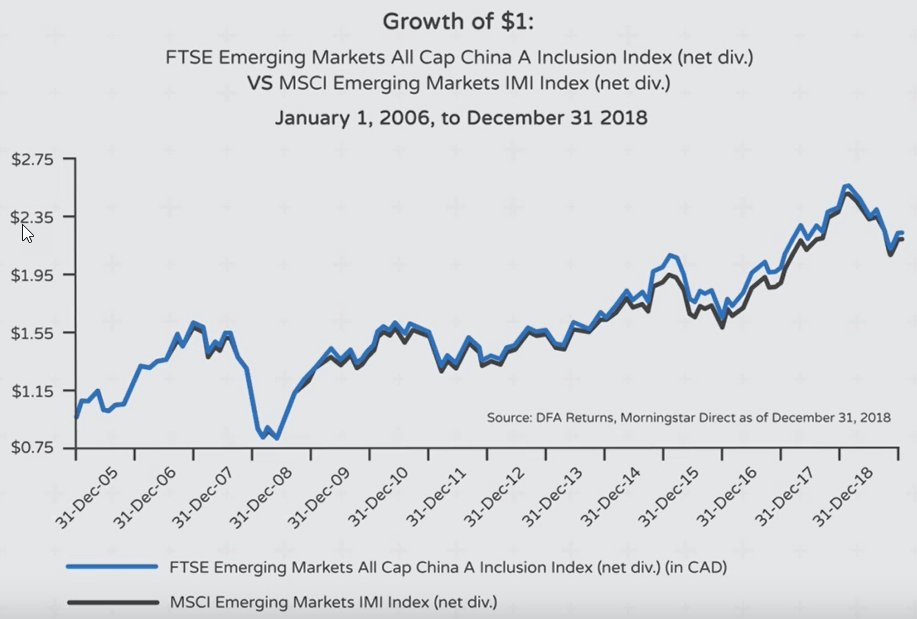
Even with this relatively large difference in country holdings, the ETFs’ underlying indices have had similar performance between 2006–2018. This may not be the case going forward, but during this period, the FTSE Emerging Markets All Cap ex China A Inclusion Index returned 6.4% in Canadian dollars on an annualized basis, while the MSCI Emerging Markets IMI Index returned 6.2%.
The Korean Conundrum
We’re getting close, but we’re not yet done with our ETF world tour! Now that you have a number of international and emerging markets equity ETFs to choose from, I’ll show you in my next video how to properly combine them, so you’re neither excluding Korea from your portfolio, nor unintentionally over-weighting it.
| Tracking ETF | Symbol | MER | Underlying Index | Number of Stocks | Dividend Yield |
|---|---|---|---|---|---|
| iShares Core MSCI Emerging Markets ETF | IEMG | 0.14% | MSCI Emerging Markets IMI Index | 2,712 | 2.9% |
| iShares Core MSCI Emerging Markets IMI Index ETF | XEC | 0.26% | MSCI Emerging Markets IMI Index | 2,712 | 2.9% |
| Vanguard FTSE Emerging Markets ETF | VWO | 0.14% | FTSE Emerging Markets All Cap China A Inclusion Index | 4,032 | 3.1% |
| Vanguard FTSE Emerging Markets All Cap Index ETF | VEE | 0.24% | FTSE Emerging Markets All Cap China A Inclusion Index | 4,032 | 3.1% |
Sources: BlackRock Asset Management Canada Limited, BlackRock Inc., FTSE Russell Indices, MSCI, The Vanguard Group, Inc., Vanguard Investments Canada Inc., as of December 31, 2018
Just wondering, three years later, if you are still using XEC instead of ZEM? Thanks in advance!
@James – I’m still currently using XEC/IEMG or VEE/VWO.
Thanks for the quick reply! Do you see anything that would prevent iShares from switching to direct ownership in the future if XEC gets sufficiently large? Do you think it’s likely they will switch?
Thanks for this. Jeremy Grantham has for a while suggested that emerging market value stocks have attractive valuations relative to the SP500. Have you looked into Avantis Emerging Markets Value (AVES)? what do you think? MER of 0.35%. I’m glad something like this is now offered. I’ve also been buying some of the emerging markets not well represented in the EM etfs — Thailand, Malaysia, Poland, Mexico, Singapore….Franklin has some cheap country-specific funds, but low volume.
@Brent – I’m an indexing purist, so I stick with broad-market emerging markets equity ETFs (anything that differs from the passive market portfolio is active management, and will either underperform or outperform – but there’s no way to know the outcome in advance).
Thanks Justin for the video on Emerging Markets. Basic, basic question- why do the model portfolios contain 3-5 times more holdings in International ETFs than in Emerging Market ETFs? And for the emerging markets, would you kindly comment on XSOE and EMQQ as comparables to those suggested in the models. Thanks!
@Diane: The CPM model ETF portfolios generally include 1 U.S. equity ETF, 1 international equity ETF, and 1 emerging markets equity ETF. O are are you referring to the number of individual stocks within the international and emerging markets equity ETFs?
XSOE is similar to a traditional emerging markets equity ETF, although it excludes state-owned companies. The methodology can be found here:
https://www.wisdomtree.com/-/media/us-media-files/documents/resource-library/pdf/research/methodologies/core-equity-index-methodology.pdf
EMQQ is an emerging markets sector ETF (internet and ecommerce companies), so it is not as diversified as the emerging markets equity ETFs in my model ETF portfolios (which include emerging markets companies across many industries/sectors).
In the last 5 years, the market return and benchmark return for VEE are 5.20% and 5.73% respectively. The corresponding numbers for XEC are 5.69% and 6.09%. The corresponding numbers for ZEM are 5.78% and 6.32%. Those are for the 5 year period ending Nov 30, except for ZEM, where it’s Nov 29.
@Park: All of these ETFs track different indices, so they are expected to have slightly different returns.
When I go to the BMO website, it states that ZEM is 6.91% iShares MSCI Emerging Markets ETF; ZEM is also 2.26% iShares MSCI Saudi Arabia ETF. I can’t see any other ETFs in its list of holdings. Distribution yield is mentioned as 1.97%. If one assumes 15% withholding tax and a 40% tax rate, then an investor will get an aftertax distribution that is about 0.16% greater than if ZEM was 100% wrap. Since the ETF’s start in Oct 2009, its benchmark index is up 79.16%; the ETF is up 66.02%.
When you go to Vanguard’s website and look at the objective section of VEE, it states “It invests directly or indirectly primarily in large-, mid- and small-capitalization stocks of companies located in emerging markets.” A few lines down, it states “Invests primarily in the U.S.-domiciled Vanguard FTSE Emerging Markets ETF.”. But I can’t find any numbers about direct investing. I think there is the suggestion in the website of direct investing playing a greater role in the future. In the Dec 31/18 financial statements, it was 100% invested in its American listed counterpart. Since inception in Nov 2011, its benchmark is up 76.01%; the ETF is up 60.78%.
@Park: VEE uses a U.S.-based wrap structure (where it invests directly in the U.S.-listed ETF, VWO). ZEM mostly purchases the underlying stocks directly. When BMO receives large cash inflows, they will purchase some U.S.-listed ETFs and gradually sell them over time (so you will likely always see a small holding of EEM).
Thanks so much for all this information! It’s super helpful as I try to figure out how to move forward with getting started investing.
I have a question about VEE. Has there been a change since you did this video/post? When I look at Vanguard’s page for VEE, the Holdings information lists a whole bunch of individual companies, like Alibaba and Naspers and the Taiwan Semiconductor Manfucaturing Company and so on for a long time. This seems to me like they’re holding the stocks directly in the fund. https://www.vanguardcanada.ca/individual/indv/en/product.html#/fundDetail/etf/portId=9556/assetCode=equity/?portfolio
In contrast, when I look at the iShares page for XEC, it lists the US-listed ETF (IEMG) they’re holding and some USD and CAD cash. That’s all they show for holdings. The wrapper concept is very clearly seen. https://www.blackrock.com/ca/individual/en/products/251423/ishares-msci-emerging-markets-imi-index-etf
So, it seems to me that VEE has changed its structure and now holds the stocks directly, so the double-level of foreign withholding tax should no longer apply. Am I reading this wrong?
This matters to me because in my particular financial situation, having funds in an RRSP doesn’t make sense so I’m working with only the TFSA, RDSP (similar tax treatment as the TFSA for foreign tax) and taxable accounts. I’m trying to be tax-efficient within those parameters, and if VEE holds the stocks directly, it becomes a clear winner over XEC for me. I can keep it in my TFSA and only lose one level of foreign withholding tax. Thanks!
@Bree: Certain pages on Vanguard Canada’s site are a bit misleading (their holdings section has always showed all the underlying stocks, even though VEE only holds a single ETF). I can confirm that VEE still just holds the U.S.-listed Vanguard ETF, VWO.
The most accurate place to look for the holdings information is in Vanguard’s annual financial statements.
The BMO MSCI Emerging Markets ETF (ZEM) holds most of the underlying stocks directly, so from a foreign withholding tax perspective, this could be an option for you. However, ZEM does not include small cap companies, and has historically had noticeable tracking error, relative to its index, due to its sampling strategy (it does not hold all stocks within the index, just a sample of them).
@Justin: Thanks for the confirmation. I had to look at few times through the annual financial statement to see it and finally found it in the “Schedule of Investment Portfolio” section. I don’t pretend to understand it all, but there’s a lot of useful data in the financial statement. I at least understand more now than I did. I really appreciate your help, especially given that so much of this information is presented in a way that doesn’t make it clear to the average layperson.
I’m not crazy about tracking error or losing the exposure to small cap companies so I guess I’m stuck with double taxation. I guess even with that for a BC resident it does still make sense to follow the priority of Canadian, then US ETF’s in taxable accounts first even if there’d be a tax refund on that second level of withholding tax on the emerging market ETF in a taxable account since the dividend yield is so high. Hopefully one day they can do an ETF that holds the stocks directly!
Hi Justin, thanks for the useful website.
I have what is probably a dumb question: I understand that there’s one level of withholding tax from the US to Canada (for XEC for example), and another level of withholding tax from the actual country where the company is located (Brazil for example) to the US (because IEMG is based in the US). Fine. But if I’m holding XEC in a taxable account, why can’t Blackrock report the dollar amount of tax paid getting dividends from Brazil to the US while compiling its tax forms, as it does while bringing that same dividend from the US to Canada, so that I can have it on my T3 from my brokerage and claim a foreign tax credit? That number should be known to Blackrock, so what’s stopping them?
Thanks!
@Tyler: Good question – unfortunately, I don’t know the inner workings of the U.S.-Canadian tax treaty systems (and why such coordination is not possible, or even attempted).
Hi Justin, should we factor in the Trading Expense Ratio (TER) in the selection of an ETF?
I was reading though the latest fact sheets of XEC and ZEM and I realized the TER rates are quite different (0.02 for XEC and 0.17 for ZEM)
Is TER a variable worth looking at?
Thanks!
@Gervais: Most broad-market ETFs have low TERs, so it’s generally not an issue. However, an ETF like ZEM (which attempts to hold the underlying stocks directly) is expected to have a higher TER than an ETF that just holds a US-listed ETF (like XEC). BMO’s 2018 management report of fund performance shows ZEM having a TER of around 0.11%.
Although ZEM arguably has a more tax-efficient structure than XEC, its tax benefits can easily be offset by higher TERs and sampling differences (I still use XEC for this reason).
So the total ETF expenses = the MER + the trading expense ratio? I have been buying ZEM in my TFSA to minimize US withholding taxes. Is it correct that you would still recommend XEC in this situation?
Thank you for the article. I did not know about TER
@Blaze Neff: Probably more like:
Total ETF expenses ~ MER + TER + FWT (foreign withholding taxes)
You could even throw in the cost of underperformance from ineffective sampling of the underlying index.
I’m still using XEC in TFSAs at this time.
Looking for an alternative to some of my foreign equity ETF’s. I’ve never looked at TER before. Is that an online source to find this information on various ETF’s? Or, is it really necessary to worry about it?
@Ed – You can find the TERs in the management report on fund performance (available on the ETF company websites). For plain-vanilla type ETFs, the TER is generally quite low or zero.
Hey Justin,
When comparing the performance of IEMG vs XEC, there is a considerable difference. For example, 5-year benchmark performance for IEMG is at 1.56%, but XEC is at 7.55%. Is this difference strictly due to foreign exchange? My understanding is these two should perform the same (minus FWT and other tax drags).
@Tyler: Correct – the majority of return differences are due to currency fluctuations.
IEMG and XEC should have similar performance, if you convert IEMG’s returns (which are quoted in U.S. dollars) to Canadian dollars.
Hi Justin,
As always, thanks for the great info. I particularly like how you talk about taxes. Keep up the good work.
I have an investment theory question: When account sizes get big, in the fixed income portion of our portfolios, we try to limit each individual bond/GIC in each account to less than $100,0000 for CDIC insurance reasons. Is there a reason to limit the amount of an individual ETF in an account?
I know that for Emerging Markets and Developed International Markets that the different ETF providers track different indices which can put different countries into Developed vs Emerging markets, and this is important to note. But for a Canadian or US broad market ETFs would you limit the amount of ETF from one provider ever (ie. Hold more than one of VCN, XIC or ZCN for Canadian or VUN/VTI for XUU/ITOT)?
There is one situation where I postulate this would be a good idea: If an investor bought a lot of VTI starting some time after 2009, and then was adding and rebalancing over time, they might have a portfolio where the unrealized gain in VTI was very large and the unrealized gain in their Canadian, International and Emerging Markets was a lot less. If this investor was rebalancing largely by addition, they might not have added a lot to their US ETF(s) for several years, but then in 2018 they might have added a bunch to their US holdings. If that investor bought ITOT or XUU or VUN (instead of adding to their VTI holdings that already had significant unrealized capital gains) then in future years, if rebalancing (that necessitated selling US ETFs) was required, this investor would have the option to sell US holdings that had less unrealized gains. If you consider thought to be valid and important, is there a specific threshold (percentage of unrealized capital gains, or absolute dollar amount) that would make you think using a (virtually identical) ETF from another company. Basically I’m wondering if you have some rules of thumb for this situation, similar to how Larry Swedroe suggests some specific thresholds when considering tax loss harvesting.
I understand the benefits of simplicity too, and that would favour just having one ETF.
Thanks in advance.
@Diego Revere: Nice out of the box thinking ;)
Yes, it can make sense from a rebalancing/liquidity perspective to eventually start holding different ETFs in the same asset class if the existing ETFs have large unrealized capital gains. It can also be useful for opening up more potential tax loss selling opportunities (as the new holding would just need to go down by 5%/$5,000 in order to pop-up on an investor’s tax loss selling radar, assuming the 5%/$5,000 Swedroe rule of thumb).
I don’t have any specific thresholds in mind, but if the market value of an ETF is double its book value, that seems like a good time to consider adding a different ETF in the same asset class.
Good info as always. Thanks for pointing out that ZEM now holds some of its stocks directly, it looks to be 64% at this point. That’s a positive development and hopefully it gets Blackrock and Vanguard moving in the same direction. Their broader indices will be harder to replicate but so long as they make an effort to start converting, investors are likely to give them some time and keep growing assets.
I look forward to XEC being interchangeable with IEMG in its tax costs the way XEF is with IEFA.
@gsp: ZEM’s individual stock allocation was around 85% when I recently recorded the narration. It appears that the fund has grown substantially over a short period of time ($556 million on Sept 30, 2018 to $775 million today), so this is likely why they’re holding EEM until they can sell it and purchase individual stocks. As you saw in the video, EEM had a cost of 0.69% on December 31, 2018, so BMO would be losing money if they only held this fund, charged 0.27%, and reimbursed the difference to investors.
Good point about the cost difference, I wonder if they’ve negociated some type of side agreement fee rebate. There’s no reason EEM should cost more than IEMG and roughly 1600 reasons it should cost less. I haven’t historically paid too much attention to BMO’s offerings and my memory is failing me, have they always held some of the ZEM stocks directly?
FWIW I hadn’t watched the video until your reply. I much prefer reading a detailed article to watching a video when absorbing information. I commend you for providing both to your followers.
gsp: I believe ZEM initially held EEM, but when the assets became large enough, they sold it and purchased the underlying stocks (or at least a sample of underlying stocks).
I usually enjoy reading more than watching a video (although my future videos will likely become more and more complex, so the video tutorial style may be easier for viewers to digest).
Justin,
I see for IEMG, XEC, VWO and VEE you compare the estimated unrecoverable withholding taxes.
Could you do this for ZEM? I realize ZEM excludes the emerging markets small cap index so they aren’t directly comparable but would ZEM be more tax efficient than XEC in an RRSP?
@BartBandy: Theoretically, yes, if ZEM held all the individual emerging markets stocks directly, it should be more tax-efficient in an RRSP than XEC from a foreign withholding tax perspective (although they’re not perfect comparisons). However, ZEM tends to hold a chunk in EEM and INDA throughout the year, so it would be difficult to calculate an estimate of the tax drag.