
Hi Justin – this is Mark H from Edmonton. PWL Capital recently published a white paper on how to estimate future stock and bond returns. Using the same methodology, what are the expected returns for the Vanguard Asset Allocation ETFs, in terms of both the expected premium above inflation, and the expected return including inflation.
Bender: Hi, Mark. Thanks for sending in your question, which I’m certain will appeal to many readers. I hope you won’t mind: When collecting the data, I’ve strayed slightly from the PWL methodology by referencing online resources anyone can access. This will allow investors to recreate their expected portfolio returns whenever they please, using the following six steps.
Step 1: Estimate Future Inflation
For this figure, we’ll head to the Bank of Canada website, where we can compare the yield of a long-term Government of Canada notional bond (which includes an inflation expectation) with the yield of a real return bond of similar maturity (which excludes inflation). The difference between these two figures provides us with the market’s ballpark estimate of future inflation. Similar to the PWL white paper, we’ll remove any short-term yield discrepancies by using the 24-month average of the yield difference between them. As of June 28, 2019, the average difference, or long-term inflation expectation, was around 1.6% (2.25% – 0.63%).
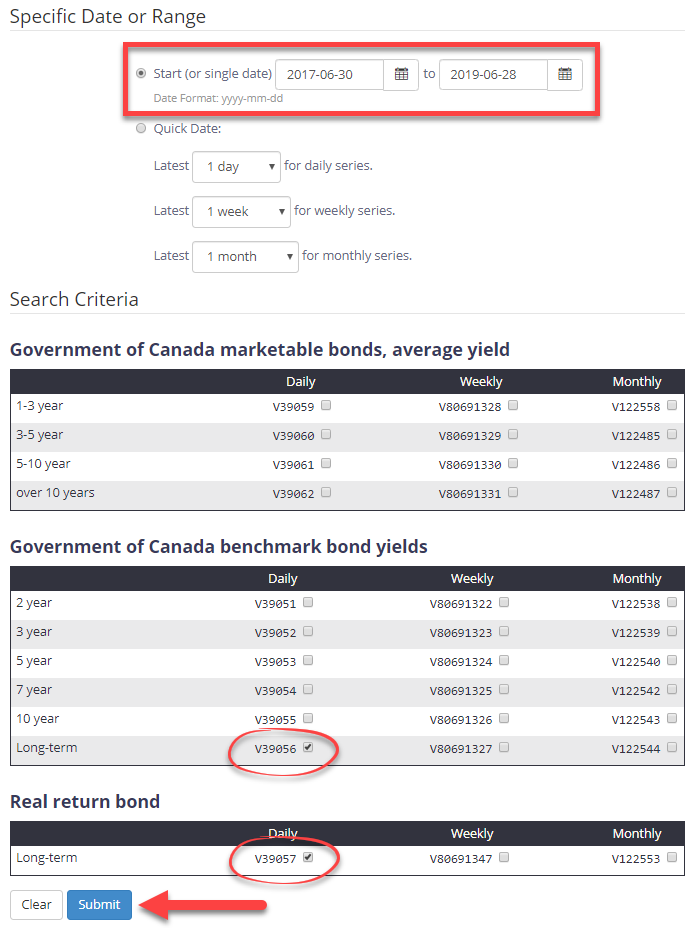
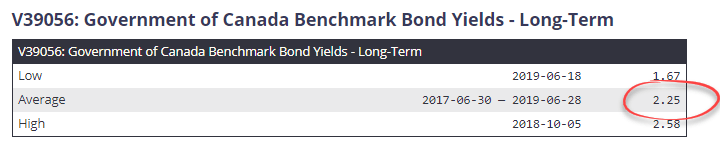
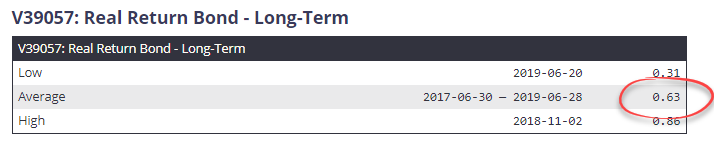
Source: Bank of Canada
Now that we have our future inflation expectation, we’ll estimate Canadian and global stock market returns over the next 10–15 years.
Step 2: Estimate Future Canadian and Global Stock Market Returns
Forecasting long-term stock returns is a bit of a mug’s game. Vanguard published a paper in 2012 where they examined 15 metrics to determine whether any of them had the ability to predict future stock returns. They found the most predictive power in valuation metrics such as price-to-earnings (P/E) ratios. But they were only meaningful over long time horizons, and even then, the P/E ratios only explained the variation in real stock returns about 40% of the time.
The best valuation metric examined in the study was the cyclically adjusted P/E ratio. Also known as the Shiller CAPE ratio, it was named after Nobel laureate and Yale Professor of Economics Robert Shiller. The CAPE ratio takes a stock’s current value and divides it by the average inflation-adjusted company earnings over the previous 10 years. A 10-year period is used to ensure that profits are averaged over more than one earnings cycle; the inflation adjustment ensures that company profits are still comparable, even during periods of high inflation.
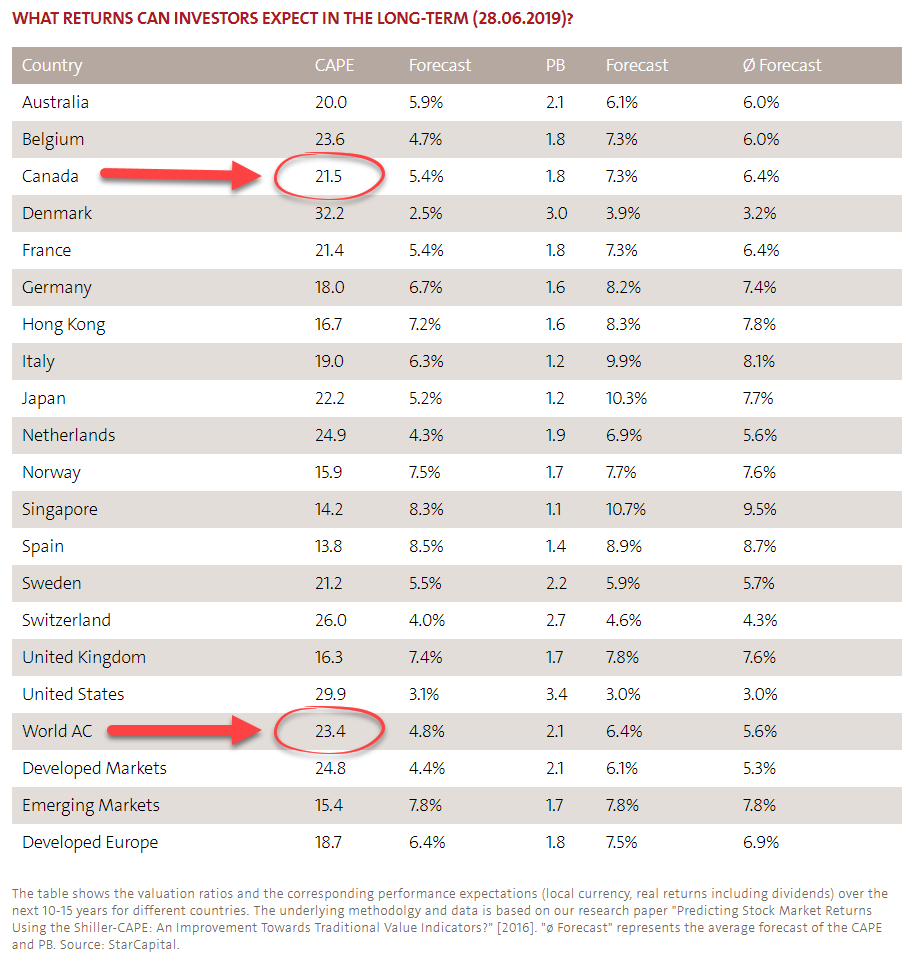
StarCapital publishes monthly global CAPE ratios for various equity regions, so I’ve used these CAPE figures for our analysis. We can obtain an earnings yield for any given stock market by taking the inverse of its CAPE ratio (which means dividing 1 by the CAPE). This can be thought of as a stock market’s expected real return. As these are real return expectations, we’ll still need to add in our 1.6% inflation expectation, so we can accurately compare them to the notional returns reported on your investment account statements.
Canadian stocks
As of June 28, 2019, the Canadian stock market had a CAPE of 21.5. Dividing 1 by the CAPE gives us an expected real return of 4.7%, or an expected nominal return of 6.3% after adding in our 1.6% expected inflation.
Global stocks
The global stock market (“World AC” on the StarCapital site) has a CAPE of 23.4. Dividing 1 by the CAPE gives us an expected real return of 4.3%, or an expected nominal return of 5.9% after adding in our 1.6% expected inflation.
So, Canadian stocks are expected to return 6.3% over the next 10–15 years, and global stocks are expected to return 5.9%. If these figures seem low to you, remember they come after a decade of incredible performance, when global stock markets returned an annual average of +12% in Canadian dollars.
| Asset Class | Country | CAPE | Expected Real Return (1 / CAPE) | Expected Inflation | Expected Nominal Return |
|---|---|---|---|---|---|
| Canadian Stocks | Canada | 21.5 | 4.7% | 1.6% | 6.3% |
| Global Stocks | World AC (All Country) | 23.4 | 4.3% | 1.6% | 5.9% |
Sources: Bank of Canada, StarCapital stock market expectations, as of June 28, 2019
It’s also interesting to note that the U.S. stock market has an even higher CAPE of 29.9, indicating low future real and nominal annual expected returns of only 3.3% and 4.9% respectively. This is no surprise, as the U.S. stock markets have been on a tear for the past ten years, delivering an annual average return of +16% in Canadian dollars. While you should not use these lower future expected returns to engage in market-timing, they could further justify a generally sound approach to diversifying your equity holdings beyond just the U.S.
Step 3: Estimate Future Canadian Bond Returns
If lower future expected stock market returns have got you down, prepare to be even more disappointed with your bonds. For the Canadian bond portion of the Vanguard Asset Allocation ETFs, the underlying bonds’ average yield to maturity (YTM) is our best estimate. This average sits at a meager 2.1% as of the end of June 2019.
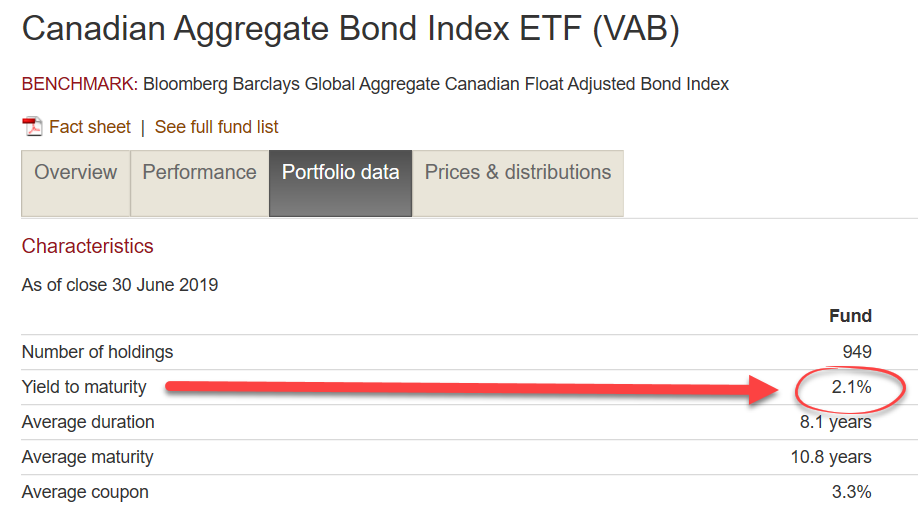
Source: Vanguard Investments Canada Inc.
Step 4: Estimate Future Currency-Hedged Global Bond Returns
The Vanguard Asset Allocation ETFs also include currency-hedged foreign bonds, and it’s a bit more complicated to estimate their expected returns. If we simply used their current YTM, U.S. bonds would be expected to return 2.5%, and international bonds would be expected to return only 0.7%. But currency-hedged global bond ETFs are also expected to provide a “hedge return” from the return on their currency-hedging strategies.
Fortunately, I’ve already done the heavy lifting on that calculation in a recent blog post, which I encourage you to revisit. Once the additional returns are factored in, global bonds currently have an adjusted YTM of around 1.9%. If you no longer had this data moving forward, you could get away with just assuming the currency-hedged global bonds are expected to return the same as Canadian bonds, or currently around 2.1%.
Step 5: Estimate Foreign Withholding Taxes
Whether you invest within a TFSA, RRSP or taxable account, your Vanguard Asset Allocation ETF will be subject to foreign withholding taxes, creating an additional drag on your returns. When you hold your ETF in a taxable account, you’ll receive a T3 slip at tax time indicating the amount of foreign tax that you’ve already paid. This acts as an “IOU” from the tax collector, which is a good thing. When you hold your ETF in a TFSA or RRSP, you receive no T3 slip, so the foreign withholding taxes you’ve paid are lost forever.
In TFSA and RRSP accounts, the annual tax drags are lower for the more conservative ETFs. They range from as low as 0.13% for the Vanguard Conservative Income ETF Portfolio (VCIP), to as high as 0.25% for the Vanguard All-Equity ETF Portfolio (VEQT). If you’re interested in estimating the foreign withholding drag of each asset allocation ETF, you can download the Foreign Withholding Tax Calculator, available on my Canadian Portfolio Manager blog.
Once you add in the 0.25% MER for Vanguard’s Asset Allocation ETFs, annual costs increase in the range of 0.38% for the most conservative asset allocation ETF, to around 0.50% for the most aggressive.
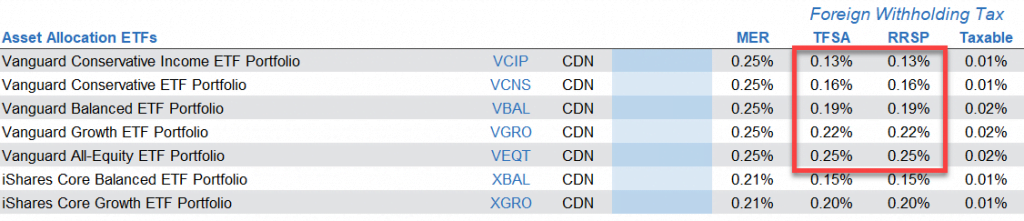
Source: Canadian Portfolio Manager blog
Step 6: Weight the Asset Class Returns
After we adjust each asset class return for its weight within the asset allocation ETFs, and we decrease them by their product fees and foreign withholding taxes, we end up with the following expected nominal return figures.
Nominal Expected Returns as of June 28, 2019
| VCIP | VCNS | VBAL | VGRO | VEQT | |
|---|---|---|---|---|---|
| Nominal Expected Return | 2.4% | 3.2% | 3.9% | 4.7% | 5.5% |
The real returns (after inflation) are even less exciting, ranging from 0.8% for the most conservative ETF, to 3.9% for the 100% equity ETF.
Real Expected Returns as of June 28, 2019
| VCIP | VCNS | VBAL | VGRO | VEQT | |
|---|---|---|---|---|---|
| Real Expected Returns | 0.8% | 1.6% | 2.4% | 3.1% | 3.9% |
The Moral of the Market Story
All this said, as we suggested at the outset, the future is uncertain. Highly uncertain. It’s important to keep that in mind when considering expected returns, even over the long-term. Over the next 10–15 years, actual returns on these asset allocation ETFs (and any other investments) could vary widely from our rough estimates.
Perhaps the key takeaway from all these calculations is as follows. Even with an all-equity portfolio, you’re probably best off if you don’t expect years and years of double-digit returns going forward. At the same time, we’ve enjoyed a solid ride for the past decade, which may or may not last for a while longer. Who knows?
In the face of eternal uncertainty about what the future has in store, the wise investor builds an efficient, globally diversified portfolio that reflects their personal long-term goals and reasonable expectations about what markets have to offer. Then they sit tight for the ride.
Hi Justin!
I enjoyed this post and refer to it frequently (as you were answering *my* question after all!), but admittedly the numbers are probably a bit stale. Can’t believe this was 4 years ago already! Would you consider doing an updated blog post for 2023? It would be interesting to read a discussion on how higher inflation impacts the nominal and real returns of asset allocation ETFs.
Hi, I have been following you for almost a year now !
I do have a question, since this page expected nominal returns for these ETFS are way lower than the ones you put in the hypothetical models from this page
https://cdn.canadianportfoliomanagerblog.com/wp-content/uploads/2021/10/Model-ETF-Portfolios-Vanguard-2021-09-30.pdf
Can you explain please ? Thank you. I just want a realistic picture of my future that’s all. Thank you very much
@Jimmy – This page contained “expected” returns for the future, while the hypothetical model portfolio returns are historical returns that shouldn’t be relied upon for future guidance.
Hi Justin,
It seems the regional CAPE ratios are no longer publicly available on the StarCapital website. Can you recommend another source for these values?
@Danny – That’s a shame. Here’s another resource that appears to update their CAPE figures every six months or so:
https://siblisresearch.com/data/cape-ratios-by-country/
Hey Justin, just a quick question here. I’m a 27 yo. investor thinking about reallocating my messy etf portfolio to VGRO or XGRO, I currently only investing in my TFSA as I’m not really in a higher tax bracket yet. So I was wondering about the withholding tax, would investing in a TFSA be alright for the mean time until I start contributing to my RRSP? In the future will having a large sum of saving in my TFSA hurt my growth or cash flow from VGRO/XGRO because of the tax withholding? Curious on what steps to take in this manner, or is paying for the convenience just part of the game? I’m willing because it will allow me to not think about it, I’m just wondering if its the most efficient method right now. Thank you!
@Stephen: If you’re investing in your TFSA, there is no way to get around the withholding tax, so holding VGRO or XGRO is fine.
Don’t let the foreign withholding tax implications drive your decision on whether to invest in an RRSP or TFSA (the decision on whether to invest in an RRSP or TFSA comes first).
Hi Justin,
Thanks for the post. Three questions:
1) Which do you think is best out of XGRO, ZGRO, VGRO, and HGRO?
2) Why are all of the above overweight Canada and EAFE and underweight US and Emerging Markets relative to the true weights in the global market cap? One thing that annoys me about these balanced ETFs is they don’t simply hold the global market cap weighted stock and bond indices. For example, I wish VGRO was 80% VT and 20% BNDW. iShares, BMO, and Horizons do not even have global stock and bond ETFs (iShares has ACWI at least).
3) According to Bogle’s book, the expected return of stocks is earnings yield + dividend yield + speculative yield. We can assume speculative yield is 0 since it goes up and down unpredictably and was ~0 over 100 years. So aren’t you missing the market dividend yield in your expected stock returns?
Thank you for your help.
Matthew
@Matthew Morrison: Thanks for reading! In regards to your questions:
1) XGRO, ZGRO and VGRO are all very similar, so you can’t really go wrong with any of them. I tend to use VGRO, but only because I am a big John Bogle fanboy. Many investors prefer XGRO, due to it’s cheaper fees, and the ability to systematically invest in the ETF at Questrade. HGRO is not really comparable to these ETFs, as it has a different tax structure and is 100% equity (whereas the others are 80% equity / 20% fixed income).
2) Historically, overweighting Canadian stocks has led to lower portfolio volatility. There are also behavioural and tax reasons to increase your allocation to Canadian stocks above the ~3% market cap. I’ve written about this topic in detail:
https://canadianportfoliomanagerblog.com/home-bias-in-the-vanguard-asset-allocation-etfs/
3) My expected returns would already include a dividend component (it’s just a slightly different methodology). Again, I wouldn’t focus too much on the expected return figures – actual returns will likely be different. Just assume that future returns could be much lower than recent returns.
Thank you for the quick reply. I have a few follow-up questions.
1) Awesome.
2) Thanks. I’ve been looking for something like this. I’ll post questions there though.
3a) I revisited Bogle’s book and his expected return is earnings growth (not earnings yield) + dividend yield + speculative yield. Where can you get data for previous earnings growth and does earnings yield = earnings growth rate + dividend yield?
3b) Just to make sure I understand your method, is stock’s expected nominal return = earnings yield (or inverse P/E or 1/CAPE) + expected inflation and bond’s expected nominal return = YTM?
3c) The reason I looked for this article in the first place was that I was planning to dynamically change my stock versus bond allocation based on some predictor for future expected return of stocks versus bonds. In other words, I was planning to have a few ETFs for my stock portion and ZAG for my bond portion. Rather than always rebalancing to say 80% stocks and 20% bonds, the bond weighting would change as a function of predicted future bond returns versus stock returns. Do you think there is merit in this approach? The R^2 using Shiller’s CAPE for predicting future returns is only 0.43 and is less than what I expected, but I think it might still make some sense, particularly with the real yield of ZAG/XBB/VAB now ~0%.
4) In step 1, I get expected inflation of 1.64% – 0.35% = 1.29% using the method you described with a daily average over the date range of 2018-10-07 to 2020-10-07. Alternatively, using the Portfolio Characteristics for XRB (iShares Canadian Real Return Bond Index ETF), I get expected inflation of 0.97% – (-0.33%) = 1.30% where 0.97% is the weighted average YTM and -0.33% is the real yield. Are these two methods equivalent?
https://www.blackrock.com/ca/individual/en/products/239490/ishares-canadian-real-return-bond-index-etf
Justin,
how did the asset allocation etfs handle the market crash and recovery this year? I am particularly interested in VEQT vs XEQT. Would it be possible for you to update your Model ETF Portfolios to include returns to June 30, 2020 on after tax basis for a taxable account. If this is not feasible at this time do you know where I could get this information?
Thank-you.
Mike.
@mike: You can download the NAVs for VEQT and XEQT from the Vanguard Canada and BlackRock Canada websites. For the crash, calculate the holding period return by dividing the March 23, 2020 NAV (bottom) by the February 19, 2020 NAV (top) and subtracting 1 from the result. For the “recovery”, choose a recovery date NAV and divide it by the March 23, 2020 NAV (bottom), and then subtract 1 from the result.
I don’t plan to calculate after-tax returns for my model ETF portfolios. Even if an investor wanted to calculate this, it can’t be done until around March 2021 anyway, as the tax breakdown information for ETFs is not available until then).
Hi Justin
Thanks for the informative analysis on Expected Returns for the Vanguard Asset Allocation ETFs. My question is as follows: If the real expected returns for VCIP and VCNS are only .8 and 1.6% respectively then why take on the added risk of buying an ETF – especially a conservative ETF like VCIP or VCNS – neither of which is likely to experience significant growth anyways? Why not just invest the funds in a high interest savings account at a discount broker? Currently, several discount brokers offer 1.6% on their high interest savings account which is about the same expected return as VCNS. One could even do better if they deposit the funds with an online bank like EQ.
Thank you.
@James: 1.6% on an investment savings account is a nominal return. After expected inflation of 1.6%, your expected real return would be zero.
Hello Justin,
I am new to investing and only recently became aware of your site. I am still making my way through all your posts. This is incredible. Thank you kindly for providing this. Your analysis above on the Expected Returns for the Vanguard Asset Allocation ETFs is a real eye opener. I am still uneasy about DIY investing as I don’t have a solid grasp of many of the concepts. But I am sure I will get more confidence as I progress through your postings. My question regarding the above post, is how do these real expected returns for, example VGRO compare to the Balanced Growth Portfolio offered by Tangerine (source: https://www.tangerine.ca/en/products/investing/investment-funds/tax-free-investment-fund/) in a TFSA/RRSP/Taxable Account. I realise the Tangerine Balanced Growth Portfolio is 25% fixed and 75% equity compared to 20% fixed and 80% equity for VGRO and I also realise the time-frame may not exactly overlap but lets for the sake of argument consider these variables equivalent. I apologise if this has already been addressed somewhere in your posts. If so, may you kindly point me in the right direction.
I am still evaluating the pros/cons between the Tangerine Balanced Growth Portfolio mutual fund versus DIY investing via Questrade and purchasing ETFs using your 3-model approach.
Sincerely,
Imy
@Imy: The expected returns on the Tangerine Balanced Growth Portfolio mutual fund would be lower than VGRO for a number of reasons:
– Most importantly, the Tangerine fund would have an expected return that is at least 0.82% lower per year. This is because its MER is 1.07%, while VGRO’s MER is 0.25% (1.07% minus 0.25% = 0.82%).
– As you mentioned, the Tangerine fund has a 75% equity allocation, while VGRO has an 80% equity allocation (so VGRO’s expected risk and return would be slightly higher)
– VGRO includes emerging markets equities (while the Tangerine fund doesn’t), which have a higher expected return than most developed markets equities (so this would also contribute to the higher expected return of VGRO).
– VGRO includes small cap stocks (while the Tangerine fund doesn’t), which would also increase the expected return of VGRO very slightly.
Overall, the lower MER on VGRO will likely make the biggest difference in expected returns, so I would focus on this when making your decision.
Thank you very much for this, Justin. My question is off topic but prompted by the use you make of the the Shiller CAPE ratios for different countries: For people investing for 10 or 20 years, it seems to imply that it would make sense to tilt portfolios to geographic regions with lower ratios, so, potentially, lowering exposure to US equities quite a bit below the proportion used in the Vanguard asset allocation ETFs. Does that make sense?
@Moti: Although the Shiller CAPE ratio is arguably the best available metric for explaining the future variability of stock market returns, it still only explains ~40% of these (so there’s another unexplained ~60%). I wouldn’t take those odds to bet on undervalued equity regions. Keep in mind the U.S. stock market has been overvalued for years (according to the CAPE) – an investor who would have underweighted or excluded U.S. equities because of this would have missed out on big stock market returns.
I find the best use for the CAPE ratio is to give investors a realistic estimate of what future returns could be, so they can plan their savings and the risk in their portfolio accordingly.
Hi Justin,
Thanks a lot for your blog. I know you don’t have a crystal ball to predict the future, based on your different articles it looks like for a taxable account I should select 2 funds portfolio VCN/XAW instead of VEQT. Do I understand it correctly?
The return difference between 11.71% and 5.5% (3.9%) is huge or did you use different techniques to calculate them?
https://cdn.canadianportfoliomanagerblog.com/wp-content/uploads/2019/03/CPM-Model-ETF-Portfolios-2019-06-30.pdf
I currently have VEQT in my TFSA. I might change when I’ll add more money next year. I don’t mind rebalancing especially between only 2 ETF.
thank you
@Ellen: I believe you may be comparing different figures.
– The 11.71% figure from the CPM Model 100% Equity ETF Portfolio (as of June 30, 2019) is the 20-year annualized standard deviation. This is a measure of risk (higher amounts generally mean more risky, while lower figures mean less risky).
– The annualized 20-year return figure for this same portfolio was 5.40%. This is an actual historical return figure, while the 5.5% expected return is a forward looking expected return figure (although, they are surprisingly very close).
– VEQT or a mix of VCN/XAW should have similar expected returns going forward.
That makes way more sense (even if I prefer the 11% ;-) ). Thanks a lot for your clarification
@Ellen: My pleasure – thanks for reading the blog :)
Justin, this is really well done doesn’t it miss the secret in the sauce – the effect of rebalancing as the equities and bonds move against each other over time? I have no idea how you would estimate it but have been wondering if the ‘instant’ rebalancing inherent in these funds is an advantage or disadvantage to periodic rebalancing among the same funds.
@Arran: The frequency of rebalancing is expected to have little impact on portfolio volatility (assuming you are actually rebalancing the portfolio to begin with).
Keep in mind that rebalancing should be thought of as a risk reduction tool. If you never rebalanced, your portfolio would become more equity-heavy (and riskier), which would increase your expected return over the long term.
There could be some form of rebalancing “bonus” for more aggressive allocations (like 80% equity, 20% fixed income), but this outcome is not certain either.
You discussed holding Canadian bond ETFs and GICs for some clients. I’d be interested to know how this applies in RESPs. As a child gets closer to post secondary (5 years away). I went with GIC but I find this is difficult as it’s harder to balance if you choose a GIC that’s longer than 1 year.
What are your thoughts to using something like VAB?
@Alexis: I typically use a combination of 1-5 year GICs and a bond ETF (for portfolio rebalancing or additional liquidity needs) for the fixed income portion of the RESP. You could use a broad-market bond ETF like VAB, or if post secondary is quickly approaching, a short-term bond ETF, like VSB).
I’ve included suggested weights between GICs/bond ETFs for rebalancing purposes in this blog post:
https://canadianportfoliomanagerblog.com/the-most-boring-battle-ever-bond-etfs-or-gics/
Wonderful post as usual. However, is this hypothesis backtested?
@Vince: Vanguard tested various metrics in their 2012 paper to determine whether any of them had predictive power: https://www.vanguardcanada.ca/documents/forecasting-stock-returns.pdf
Thanks for this excellent article Justin!
How would I calculate expected returns for a periods after 15 years? Would the historic long-term average be appropriate?
@Nathan: I would just assume the same returns as the 10-15 year assumptions to be conservative (but you can adjust these assumptions over time).
Hi Justin,
With appreciation I wanted to say thanks for your contributions in this blog to DIY investors. I read the little book of Common Sense Investing by John Bogle and it made me aware of what I wasn’t aware of.
I wanted to revisit the comment made earlier from @Taofr: I had the same questions but with $110,000 CAD to invest into ETFs. I am a buy and hold, long-term and high tolerance to risk type of investor. My plan was to invest into a VGRO leaving it for the longterm at least 20~25 years without touching it and sitting back for the ride.
Would you say that the one-decision asset allocation ETF such as VGRO/VEQT is a sound approach in comparison to either a 3 or 5 ETF portfolio? Or would it be best to strategically pick the 3~5 individual ETFs and re-balancing once a year?
I want to check my blindspots and I appreciate your guidance.
BR,
Duane
@Duane: A 3-ETF or 5-ETF portfolio is essentially the same as a 1-ETF portfolio.
The main benefit of breaking up your 1-ETF portfolio is in an RRSP (if you use U.S.-listed foreign equity ETFs):
https://canadianportfoliomanagerblog.com/breaking-up-with-your-vanguard-asset-allocation-etf/
https://canadianportfoliomanagerblog.com/more-alternatives-to-vanguards-asset-allocation-etfs/
Hello. Thank you for your excellent article. I still ask myself a question: by using only inflation to explain long-term earnings growth, and ignoring productivity and population growth, do not we underestimate the profit growth? And so also the expected return on equities?
@Taofr: I would assume that population and productivity growth assumptions would already be accounted for in current stock prices.
I agree that we can assume that these elements are already considered in the stock prices. So I think it’s unfair not to take that into account in the estimation of the returns. I will try to present this from another angle. Inflation is intended to measure the growth of consumer goods and services. In a world of increasing productivity, it seems to me legitimate to assume that the value of a productive asset is growing faster than inflation, in addition to its production. To illustrate, we can say that the yield of a factory is the sum of its production net of costs (profits), the increase in the value of the goods it produces (inflation) and the increase of units produced (productivity gain). Is there an error in this reasoning?
@Taofr: I think that’s fair, but all of these portfolios do have an expected positive real return (so hopefully they will grow by more than inflation).
I saw your video on the One-Decision Asset Allocation ETFs. I am looking to start investing into ETFs and consumed your resources on:
– 3 vs 5 ETF portfolios
– asset allocation (Can, US, International, Emerging, Bonds)
– which individual ETFs are recommended per allocation
As a new investor who will be investing $1000, and making $150 purchases every month, I have 2 questions:
1) are Asset Allocation funds such as VEQT worth it? A) Do 5 ETF portfolios outperform One-Asset Allocation funds?
B) How much am I saving by doing the extra work of a 5 ETF portfolio?
2) does the following accurately make up the list of “work” in managing a 5 ETF portfolio, or is there more:
– buying the ETFs online
– balancing the ETFs 1-2x per year
– staying up to date on which ETFs to invest in
@Aharon: For a $1,000 portfolio (with subsequent $150 monthly purchases), the one-fund asset allocation ETFs would be more appropriate than managing 5 ETFs (the annual cost difference would be minimal). Consider using a low-cost brokerage, like Questrade, to save on trading commissions.
Great post ,I agree with David. It goes from Bogel to Bender, to me. Lovely:)
Thanks for your efforts.
Makes me smile when I read about planners using past returns as guidance for future expectations. These numbers are a reminder that cost is a huge part of your returns.
Hi Justin,
Thanks for the great article, as always.
I had a question regarding the return rates. If I have about $15,000 that I wanted to invest in a TFSA and my goal is to leave that money in there for 20+ years and add to it each year I generate income, is it worth it to choose VEQT over VGRO?
Since both VEQT & VGRO are new funds, we lack some historical data. My concern is if it is worth it to invest in VEQT over VGRO because historically, equities outperform bonds, thus with a full equity profilo I would theoretically earn more over a 20+ year period.
I am 23 and new to investing and this $15,000 is something I would not need for at least 20 years. Evidently, I have a high-risk tolerance, but I guess I am having trouble on why one would choose VGRO over VEQT if the time horizon is 20+ years.
Thanks again for your helpful posts!
@Mario: I’ve back-tested the historical returns for VEQT and VGRO in the Model ETF Portfolios section of the blog:
https://canadianportfoliomanagerblog.com/model-etf-portfolios/
Over the past 20 years (as of August 31, 2020), VEQT’s hypothetical returns underperformed VGRO’s hypothetical returns (but over the past 25 years, VEQT slightly outperformed VGRO). Over the next 20-25 years, we don’t know which asset mix will outperform the other. Just choose whichever allocation you’re comfortable with, and then focus on your savings plan.
Hi Justin,
Thanks for the quick reply!
Amazing! I definitely feel like I have been overthinking!
I will probably end up choosing VGRO just due to the sheer volume of assets in comparison to VEQT.
Thanks again!
Thank you for yet another great post!
If it weren’t for this blog, my investments would still be in high fee mutual funds eroding the returns.
They say that John Bogle democratized investing. I would say that you have democratized the world of financial advice. Your blog posts and your answers to our questions have steered me away from huge mistakes and pitfalls in investing.
I really appreciate your time and hard work. I will keep coming back for as long as this site is live.
@David: You’re very welcome, David – and thank you for the kind words. John Bogle was my inspiration for getting into the industry – he was a true investor advocate.
Another brilliant piece of analysis by Justin !! Vanguard suggest US and global bonds ( hedged to loonies) in designing their AA models for these ETFs. Their rationale is that it adds diversity, one is exposed to different yield curves and different interest rate environments globally which can potential add to returns in the long run, all the while minimizing risk.
I think Dan Bortolotti mentioned in his podcast he only uses Canadian Bonds for his clients, do you have a strong opinion either way for your older clients who have lets say a 20 year investing horizon ?
Thanks
Lyndon
@Dr Lyndon Mascarenhas: I tend to still hold just Canadian bond ETFs and GICs. If the product fees/foreign withholding taxes were to decrease for currency-hedged global bond ETFs, I might be more inclined to start recommending them to clients.
Great post, thank you!
In my projections for my 75//25 portfolio, I use a pre-inflation return of 5% and an inflation rate of 3%, so the post’s conclusion is good news for me.
If you were to apply this same methodology to the data of 10 years ago, do you think the resulting projected returns would have been in the ballpark of the actual returns?
@Bob Lin: I don’t have the CAPE figures from 10 years ago, but the expected equity returns would have been much higher than today’s expected returns (as stock market values were much lower). Bond yields were also higher back then, so the 10-year forecast (as of June 30, 2009) would have likely been at the very least, in the right direction and around the correct magnitude.