In my last post, we reviewed the recent underperformance of the Vanguard U.S. Aggregate Bond Index ETF (CAD-hedged) (VBU) vs. the Vanguard Total Bond Market ETF (BND). Although VBU’s additional product fees and foreign withholding taxes explained some of the difference, a good chunk of return was lost due to the fund’s currency-hedging strategy. This is not a knock against Vanguard, but rather the expected result of an efficient forward pricing mechanism. The negative returns from hedging the U.S. dollar over the past few years were mainly the result of the differences between Canadian and U.S. interest rates.
But what does the future have in store? What returns can a Canadian investor expect from currency-hedged global bond ETFs? To account for the expected returns from currency hedging, this post will show you how to adjust the yield to maturity (our best estimate of a bond’s future return) on two popular Vanguard foreign bond ETFs.
We’ll start with the U.S. fixed income ETF, the Vanguard U.S. Aggregate Bond Index ETF (CAD-hedged) (VBU).
U.S. Currency-Hedged Bonds
VBU holds the U.S.-listed Vanguard Total Bond Market ETF (BND), and then hedges the U.S. dollar exposure back to Canadian dollars, using forward contracts. These forward contracts usually mature in a month, at which time new contracts are entered into at the prevailing one-month forward rates.
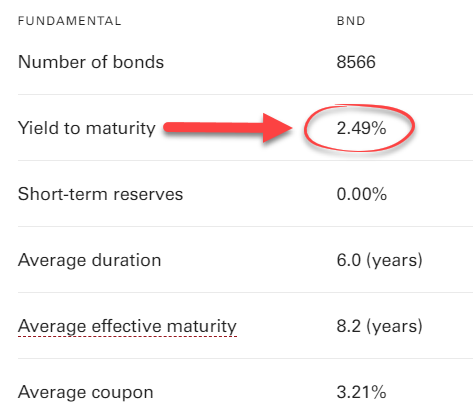
BND had an average yield to maturity (YTM) of 2.49% as of June 28, 2019. But as we just learned, currency-hedged investors shouldn’t expect to earn just this return. The expected return for a Canadian investing in VBU will be a combination of BND’s YTM, plus (or minus) VBU’s return from its currency-hedging strategy.

Source: The Vanguard Group Inc., as of June 28, 2019
To estimate the hedge return, we can use the current spot price of 1.3095 (CAD per USD) and the one-month forward price of 1.308545. If we divide the forward price by the spot price and subtract 1, we end up with a one-month hedge return of –0.07%. Annualized, that becomes –0.87%.

As BND’s YTM is 2.49%, the hedge return of –0.87% will reduce the YTM on VBU to around 1.62% (2.49% – 0.87%). Before accounting for product fees and foreign withholding taxes, this figure would be a decent back-of-the-napkin estimate for a Canadian investor buying VBU.
What if we compare VBU’s adjusted YTM to the YTM of a Canadian bond ETF like the Vanguard Canadian Aggregate Bond Index ETF (VAB)? We see VBU’s YTM is lower. This makes intuitive sense, as VBU has a lower average duration and average maturity than VAB. Since VBU has less term risk, we would expect it to also have a lower return.
| VBU | VAB | |
|---|---|---|
| Average duration | 6.0 years | 8.1 years |
| Average maturity | 8.2 years | 10.8 years |
| Yield to maturity | 1.6%* | 2.1% |
Sources: Bloomberg, The Vanguard Group Inc., Vanguard Investments Canada Inc., as of June 28, 2019
*YTM has been adjusted for the expected return from currency hedging.
International Currency-Hedged Bonds
Next up, let’s look at the Vanguard Global ex-U.S. Aggregate Bond Index ETF (CAD-hedged) (VBG), which holds the U.S.-listed ETF, the Vanguard Total International Bond ETF (BNDX).
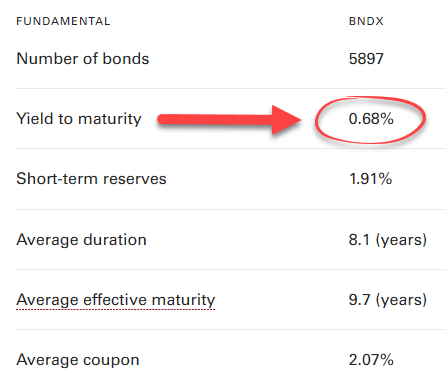
Most foreign investors would rather stuff their money under a mattress before investing in an international bond ETF, currently yielding only 0.68%. But as we learned above, the current YTM is only part of the expected return of a currency-hedged global bond. Investors also can expect a hedge return.

Source: The Vanguard Group Inc., as of June 28, 2019
VBG’s adjusted YTM is a little trickier to calculate, as BNDX first hedges the underlying currencies back to U.S. dollars, and then VBG (which holds BNDX) hedges the U.S. dollars back to Canadian dollars. (Confusing, right?!)
We’ll start by calculating the first level of BNDX’s estimated hedge return. This is what a U.S. investor would expect to earn, in addition to the fund’s YTM.
1. BNDX hedge return from a U.S. perspective
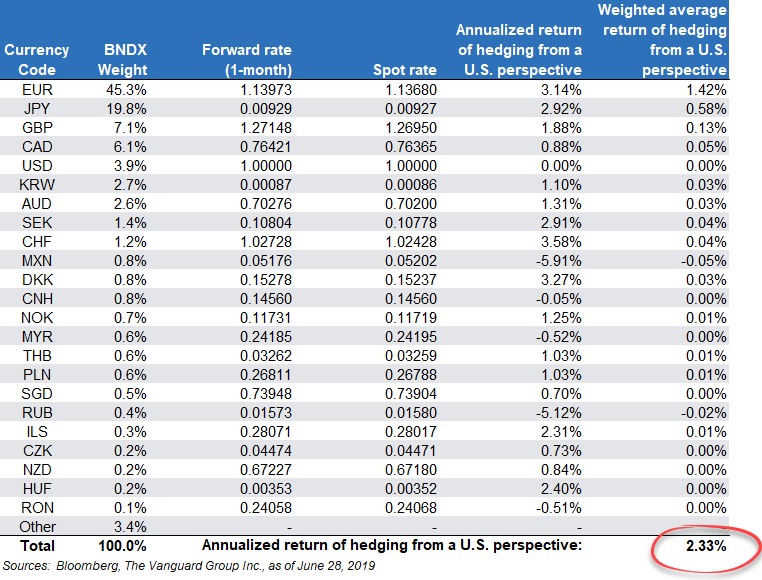
BNDX is exposed to many underlying currencies: the euro, yen, pound sterling, Canadian dollar, and others. Vanguard then hedges these currency exposures back to U.S. dollars. In the chart below, I’ve calculated the hedge return for most of BNDX’s underlying currencies, and then weighted them accordingly. The result is an annualized expected hedge return of +2.33% for a BNDX U.S. investor. If we add this estimated hedge return to the fund’s YTM, we end up with an expected +3.01% adjusted YTM for U.S. investors.

Again, this makes intuitive sense. BNDX has a higher duration and higher average maturity than BND. So once we’ve adjusted BNDX’s YTM for its expected return from currency hedging, a U.S. investor should expect a higher yield from it.
| BND | BNDX (USD-Hedged) | |
|---|---|---|
| Average duration | 6.0 years | 8.1 years |
| Average maturity | 8.2 years | 9.7 years |
| Yield to maturity | 2.5% | 3.0%* |
Sources: Bloomberg, The Vanguard Group Inc., as of June 28, 2019
*YTM has been adjusted for the expected return from currency hedging.
2. VBG hedge return from a Canadian perspective
Now that we’ve calculated the expected return for a BNDX U.S. investor, we just need to calculate the return from hedging the BNDX U.S. dollar exposure back to Canadian dollars (like VBG does). You’ll note that the process is identical to our first example, when VBU hedges BND’s U.S. dollar exposure back to Canadian dollars. As the calculations are the same, the annualized return from the Canadian hedging is also the same, at –0.87%.

If we add BNDX’s 0.68% YTM, plus the U.S.-perspective 2.33% hedge return, plus the Canadian-perspective –0.87% hedge return, we end up with a 2.14% expected return for VBG (before product fees and foreign withholding taxes). Once again, the estimate makes intuitive sense, as VBG has a similar average duration and average maturity as VAB.
| VAB | VBG | |
|---|---|---|
| Average duration | 8.1 years | 8.1 years |
| Average maturity | 10.8 years | 9.7 years |
| Yield to maturity | 2.1% | 2.1%* |
Sources: Bloomberg, The Vanguard Group Inc., as of June 28, 2019
*YTM has been adjusted for the expected return from currency hedging.
Next: What About Expected Returns for Vanguard’s Asset Allocation ETFs?
Putting it all together, here are a Canadian investor’s expected fixed income returns for the bond ETFs within the Vanguard Asset Allocation ETFs:
| Fixed Income ETFs | Expected Return |
|---|---|
| Vanguard Canadian Aggregate Bond Index ETF (VAB) | 2.1% |
| Vanguard U.S. Aggregate Bond Index ETF (CAD-hedged) (VBU) | 1.6%* |
| Vanguard Global ex-U.S. Aggregate Bond Index ETF (CAD-hedged) (VBG) | 2.1%* |
Sources: Bloomberg, The Vanguard Group Inc., Vanguard Investment Canada Inc., as of June 28, 2019
*YTM has been adjusted for the expected return from currency hedging.
You’ve probably already noticed that expected returns for the global bond ETFs are similar to those for the Canadian bond ETF. As a rule of thumb, instead of going through all that effort, it’s probably reasonable to assume that currency-hedged foreign bond returns will likely be similar to Canadian bond returns going forward (before additional product fees and foreign withholding taxes).
In my next blog, we’ll estimate the expected long-term returns for each Vanguard Asset Allocation ETF as a whole – based on another excellent question from one of our faithful followers.


Hey Justin:
I found this old(ish) post when looking into whether I should hold some global bonds. This post is great, but one question it didn’t answer is: does the hedging return show up in the interest payments or in the asset price (or both)?
The reason I ask is there’s no equivalent I’m aware of to ZDB for global bonds. If I were to buy something like VGAB (2% coupon, 1% YTM) in a taxable account, on the surface that appears to have the “premium bond” tax issue. However, if the rule of thumb holds and the expected return would be closer to VAB’s YTM (1.8%) – the term and credit risk appears fairly similar between the two ETFs – if the 0.8% estimated hedging return shows up in the asset price, that really minimizes the “premium bond” tax-inefficiency (2% payments vs 1.8% expected return), but not if it’s added to the coupon (2.8% payments vs 1.8% expected return)
Thanks as always,
Graeme
@Graeme – Unfortunately, I haven’t dug into these details more than what I’ve posted on the blog. I would assume there’s still a premium bond issue, but I’m not certain.
Thanks for the response, the whole idea of the “hedge return” makes my brain hurt :). And now that I’ve started down this rabbit hole, it gets even weirder: I figured I might be able to answer my above question by looking at the 12-month yield which should reflect income and VGAB’s was a surprisingly low 1.15% (somehow around a percent below the coupon, which doesn’t make a lot of sense to me).
Even more surprising, according to MorningStar, the 1-year total return of VAB is –4.38% and for VGAB it’s -1.75% (VGAB’s smaller principal loss more than made up for the lower yield): given the ETFs look quite similar overall, I found a 2.5% difference to be pretty shocking. VGAB was somehow significantly better from both a return and tax-efficiency perspective in the last year.
Anyways, not looking for an answer, just figured I’d post this followup since I found it interesting. And totally possible I’m completely missing something or made some dumb mistake in my amateur fund analysis haha.
Hi Justin. It was pointed out to me that these bond etfs are carrying large amounts of bonds with negative yields. In trying to make sense of this I came across this article and others that have suggested currency hedging will help counter the negative yield. Is that why they are being included in these global bond etfs or is it just the state of the market that is driving these negative yields and they are included to be reflective of the index. Thanks for your insights.
@Greg: As the existing asset allocation ETFs have a target bond allocation, I would expect Vanguard to include bonds regardless (even if they had negative yields).
However, perhaps Vanguard wouldn’t have included foreign bonds in their asset allocation ETFs, if these would have resulted in negative expected yields after currency-hedging. And perhaps they would have never released asset allocation ETFs in the first place if Canadian bonds had negative yields, as the investor demand for these products may not have been as high.
Hi Justin, thanks for the great analysis which made me understasnd currency hedging much better. I assume the same applies to currency-hedged stock ETFs as well. I always thought “currency hedged” meant the ETF return would be protected from any currency fluctuation, but this is not true according to your article. Now my question is “why picking a currency-hedged ETF if currency fluctuation actually affects its return, and paying a higher MER?” Am I missing something? Please advise. Thanks.
@Joe: The currency-hedged global bond ETFs are generally protected from currency fluctuations – there is just a separate component of their return (the hedge return), based on forward rates (which are based on interest rate differences between the countries).
As you noted, if you want global fixed income diversification without the currency risk, there is generally more cost and taxes for Canadian investors at this time. I’ve chosen not to globally diversify our clients’ fixed income holdings for these reasons, but other investors may feel differently (if costs came down in the future, I would consider including global bond ETFs in the PWL portfolios). Overall, I don’t think taking on this additional cost is a terrible option for Canadian investors, so I’m still comfortable with Vanguard’s decision in this regard.
Very interesting post, Justin. When you calculate expected returns on these funds, you are calculating them for the next month that corresponds to the forward rates, correct? The forward rates are market prices that can be higher or lower than the spot rate and so these expected returns will change from month to month. Am I correct in these assumptions?
@GregJP: The bond yields, spot rates and one-month forward rates are all as of June 28, 2019.
Thank you for another great post, Justin!
With higher MERs of VBU (0.22%) and VBG (0.35%), it makes sense to stick with ZAG/ZDB/GIC ladder.
Your model portfolio of ZAG/VCN/XAW looks very simple at first look, but it amazes me how much thought and consideration have been given behind this recommendation.
I look forward to your next post!
@David: You’re very welcome! The next post will be available next Tuesday – enjoy! :)
Hi Justin, super interesting post! For someone who wants to repeat this analysis, where can someone find the forward rates themselves? I’ve found https://www.barchart.com/forex/quotes/%5EUSDCAD/forward-rates, for example. But the mid-rate is 8.03850… not sure how to get from this to the number you quoted in your post.
@Tyler: I obtained the forward rates from our company Bloomberg terminal (I unfortunately don’t know of any free and accurate resources online).
Interesting! I never thought of doing that exercise (too much for my mind!) Now, what about the best product to hold in a registered CAD account? Are there any Bond ETF that offers the best solution for a retiree with a 5-10 years period?
@Peter: Unfortunately there’s no magic bond ETF for every specific situation. Retirees will usually have a mix of investment savings accounts (cash), 1-5 year GICs or short-term bond ETFs, and broad-market bond ETFs.
A highly relevant post for me at this moment as I’m currently building a large portfolio based on the Vanguard Asset Allocation ETFs and have been pondering whether to add in these funds or just use ZDB for all fixed income. As always, thank you, sir.
Bjorn: You’re very welcome! Please let me know if you have any questions as you work through the decision.