In our last two blogs, we found that index providers FTSE and MSCI currently disagree on how to classify Korean markets (as well as a few other smaller countries’ markets). FTSE allocates Korean stocks to its developed markets indices, while MSCI allocates them to its emerging markets indices. We also learned that the iShares international and emerging markets equity ETFs follow the MSCI indices, while the Vanguard international and emerging markets equity ETFs follow the FTSE indices.
Today, I’ll stick to the Canadian-listed ETFs, but this discussion also applies to their U.S.-listed counterparts.
Doing the Korean Two-Step
So, why does it matter where each index happens to allocate its Korean stocks? Given the different treatments, if you don’t pair up your portfolio properly, you could end up accidentally doubling your exposure to Korean companies … or, on the flip side, omitting it entirely.
Double the Trouble: You’ll double your exposure if you combine a Vanguard developed markets equity ETF (which includes Korean stocks) with an iShares emerging markets equity ETF (which also includes Korean stocks). So, if you combine the Vanguard FTSE Developed All Cap ex North America Index ETF (VIU) with the iShares Core MSCI Emerging Markets IMI Index ETF (XEC), you receive two helpings of Korean company exposure (assuming a market cap weighting, which we’ll discuss further on).
An Error of Omission: You’ll receive no exposure to Korean stocks if you combine an iShares developed markets equity ETF (which exclude Korean stocks) with a Vanguard emerging markets equity ETF (which also exclude Korean stocks). So, if you combine the iShares Core MSCI EAFE IMI Index ETF (XEF) with the Vanguard FTSE Emerging Markets All Cap Index ETF (VEE), your Korean stock exposure is a big, fat zero.
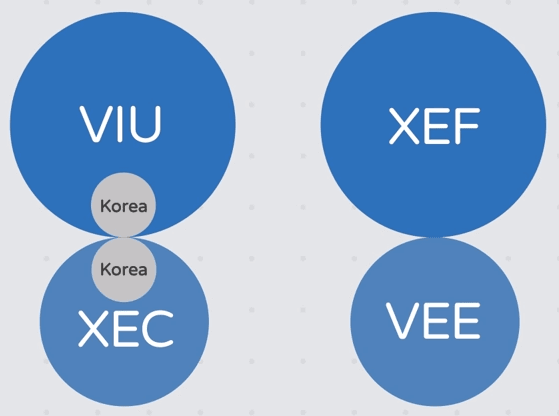
Ideally, investors seeking an appropriate allocation to Korean stocks should EITHER:
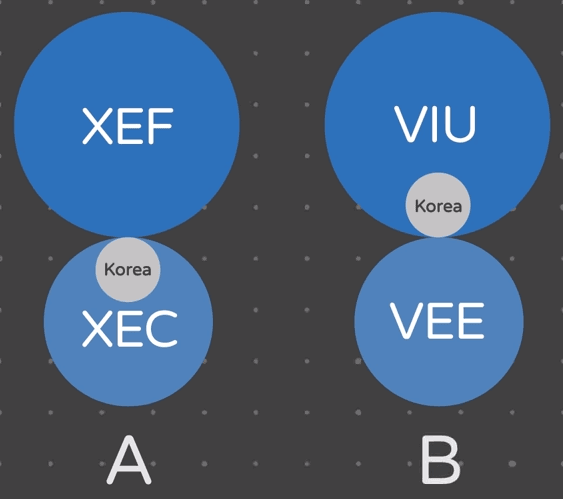
A) Combine iShares international and emerging markets equity ETFs together, OR
B) Combine Vanguard international and emerging markets equity ETFs.
So, XEF pairs with XEC, while VIU pairs with VEE. This ensures that only one of the ETFs in your combo includes Korean companies.
Market Cap Calculations for Fun and Profit: iShares ETFs
This seems straightforward enough. But riddle me this: What portion of your investment dollars do you allocate to each ETF? We suggest allocating your dollars based on each region’s current market cap weighting. This is how many global equity ETFs do it, including Vanguard’s asset allocation ETFs (which is a subject for another discussion, some other day).
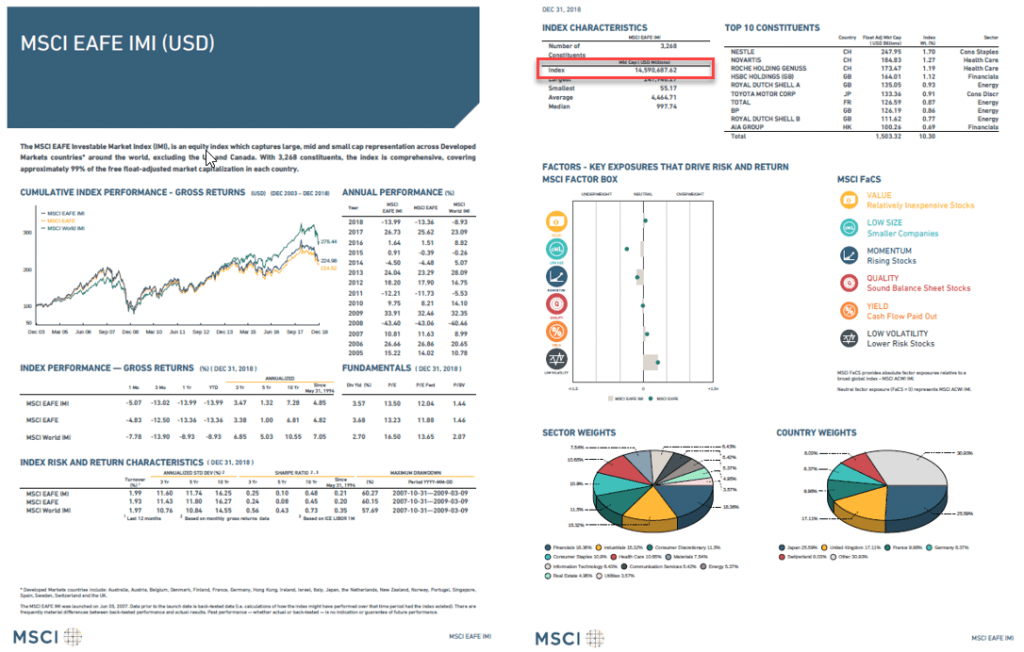
To learn how to employ market cap weighting like a pro, let’s start with the iShares ETFs. First, google MSCI EAFE IMI Index Fact Sheet and download the most recent month-end PDF. (Ensure that the document is the U.S. dollar version.) This is the underlying index for the iShares Core MSCI EAFE IMI Index ETF (XEF).
Source: MSCI EAFE IMI (USD) Index Fact Sheet, as of December 31, 2018
At the top-left corner of the second page, you’ll find the market cap of the index (in USD millions). As of December 31, 2018, this amount was $14,590,688.
Follow the same process for XEC’s underlying index, the MSCI Emerging Markets IMI Index. Based on its December 31, 2018 index fact sheet, we find that its market cap in USD millions was $5,417,489.

Source: MSCI Emerging Markets IMI (USD) Index Fact Sheet, as of December 31, 2018
Now for some math. The total combined market cap of the MSCI EAFE IMI Index and the MSCI Emerging Markets IMI Index is $20,008,177. Dividing the MSCI EAFE IMI Index $14,590,688 market cap by the $20,008,177 total combined market cap gives us 72.92%. Voila – that’s the approximate percentage to allocate to XEF. So, if you were investing $10,000 into both iShares international and emerging markets equity ETFs, you’d purchase about $7,292 of XEF ($10,000 x 72.92% = $7,292).
The rest of the $10,000, or $2,708, could go to XEC. But, if you wanted to verify that, you could do so by dividing the $5,417,489 XEC market cap by the $20,008,177 total market cap to equal 27.08% ($10,000 x 27.08% = $2,708).
| Tracking ETF | Underlying Index | Market Cap (in USD Millions) | Market Cap (%) | Allocation ($) |
|---|---|---|---|---|
| iShares Core MSCI EAFE IMI Index ETF (XEF) | MSCI EAFE IMI Index | $14,590,688 | 72.92% | $7,292 |
| iShares Core MSCI Emerging Markets IMI Index (XEC) | MSCI Emerging Markets IMI Index | $5,417,489 | 27.08% | $2,708 |
| Total | $20,008,177 | 100.00% | $10,000 |
Sources: MSCI EAFE IMI (USD) and MSCI Emerging Markets IMI (USD) Index Fact Sheets as of December 31, 2018
More Market Cap Adventures: Vanguard ETFs
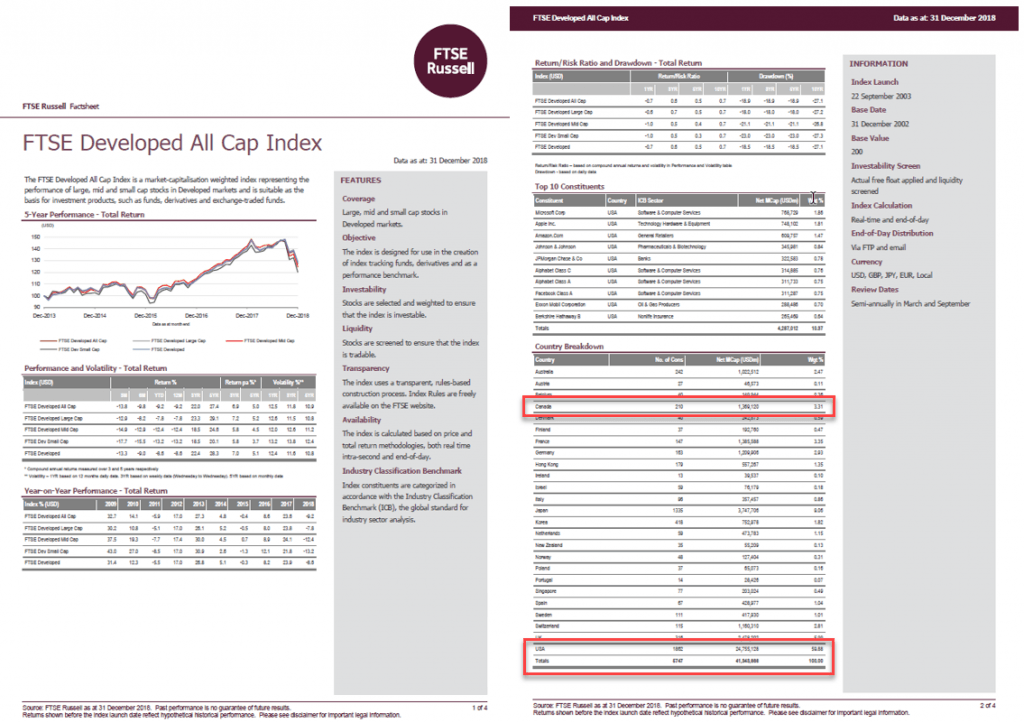
We can do the same thing for Vanguard ETFs, although it has a few more steps. We’ll start by searching for the FTSE Developed All Cap Index fact sheet (in U.S. dollars). Although we are really looking for the FTSE Developed All Cap ex North America Index fact sheet, it’s not readily available. Not to worry; we can adapt this fact sheet for our purposes.
Source: FTSE Developed All Cap Index Factsheet, as of December 31, 2018
We’re looking for the country breakdown on page 2. As of December 31, 2018, the index market cap was $41,343,666 in USD millions. However, this figure includes North American companies, so we need to deduct the Canada/U.S. market caps from the total. Canada and the U.S. have a market cap of $1,369,120 and $24,755,128 in USD millions, respectively. Therefore, the market cap of the FTSE Developed All Cap ex North America Index is $15,219,418 in USD millions.
| Index | Market Cap (USD Millions) |
|---|---|
| FTSE Developed All Cap Index - FTSE Canada All Cap Index - FTSE USA All Cap Index | $41,343,666 ($1,369,120) ($24,755,128) |
| FTSE Developed All Cap ex North America Index | $15,219,418 |
Source: FTSE Developed All Cap Index Factsheet, as of December 31, 2018
Next we’ll download the month-end fact sheet for the FTSE Emerging Markets China A Inclusion Indexes. Please note, while this fact sheet contains multiple indices, we are only interested in the market cap of the FTSE Emerging Markets All Cap China A Inclusion Index. You’ll find it in the Country Breakdown section under the appropriate index heading. As of December 31, 2018, this index’s market cap was $4,830,248 in USD millions.
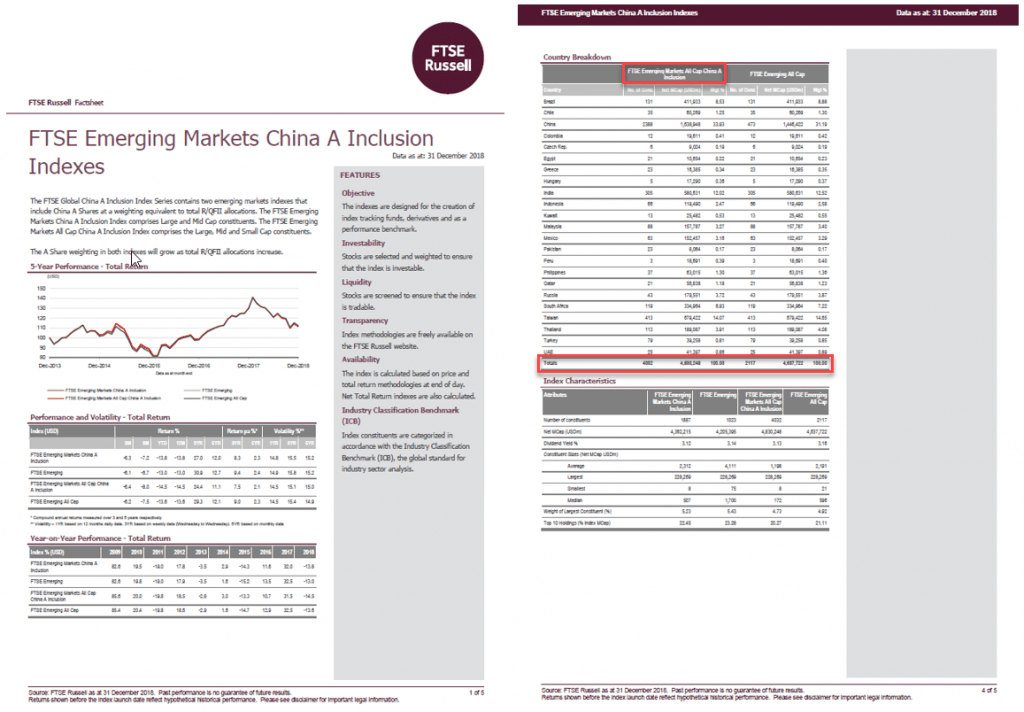
Source: FTSE Emerging Markets China A Inclusion Indexes Factsheet, as of December 31, 2018
Now we’re back on track to compute our allocations, just as we did for the iShares ETFs. The total market cap of the FTSE Developed All Cap ex North America Index and the FTSE Emerging Markets All Cap China A Inclusion Index is $20,049,666. Dividing $15,219,418 by the $20,049,666 total market cap gives us 75.91%, which is the approximate percentage to allocate to VIU. If we were investing $10,000 into Vanguard international and emerging markets equity ETFs, we would purchase about $7,591 of VIU ($10,000 x 75.91% = $7,591).
Likewise, the remaining $2,409 balance could go to VEE … or you can verify that by dividing $4,830,248 by the $20,049,666 total market cap to arrive at 24.09% ($10,000 x 24.09% = $2,409).
| Tracking ETF | Underlying Index | Market Cap (in USD Millions) | Market Cap (%) | Allocation ($) |
|---|---|---|---|---|
| Vanguard FTSE Developed All Cap ex North America Index ETF (VIU) | FTSE Developed All Cap ex North America Index | $15,219,418 | 75.91% | $7,591 |
| Vanguard FTSE Emerging Markets All Cap Index ETF (VEE) | FTSE Emerging Markets All Cap China A Inclusion Index | $4,830,248 | 24.09% | $2,409 |
| Total | $20,049,666 | 100.00% | $10,000 |
Sources: FTSE Developed All Cap Index and FTSE Emerging Markets China A Inclusion Indexes Factsheets, as of December 31, 2018
Similar ETFs, Similar Allocations
So there you have it. Depending on which ETF company you choose, you can use a market cap weighting approach to achieve very similar allocations to international and emerging markets. You’ll find only modest differences between the underlying country allocations, with Korea representing a nearly identical allocation in each. Also, by pairing either Vanguard-with-Vanguard or iShares-with-iShares, you’ll be “just right” on your Korean stock exposure – neither double-dipping nor eliminating the allocation entirely due to differing definitions for the same stocks.
| Country | XEF + XEC | VIU + VEE | Difference |
|---|---|---|---|
| Japan | 18.4% | 18.7% | -0.3% |
| United Kingdom | 12.7% | 12.4% | +0.3% |
| China | 7.6% | 8.1% | -0.5% |
| France | 7.2% | 6.8% | +0.4% |
| Germany | 6.1% | 6.0% | +0.1% |
| Switzerland | 5.8% | 5.8% | 0.0% |
| Australia | 5.0% | 5.1% | -0.1% |
| Korea | 3.9% | 3.8% | +0.1% |
| Taiwan | 3.3% | 3.4% | -0.1% |
| India | 2.8% | 2.9% | -0.1% |
Sources: BlackRock Asset Management Canada Limited, Vanguard Investments Canada Inc., as of December 31, 2018
Coming up next, we’ll pop the hoods on a number of global equity ETFs that use a similar global market cap weighting scheme for their underlying country allocations.


Thanks again for your blog. I find this website the best resource online for DIY investing and has helped me tremendously! Just trying to decide between XEF/XEC pairing and VIU/VEE pairing.
One question is had is why is there a discrepancy between MSCI EAFE IMI constituents (3090 holdings based on the index fact sheet published Dec 31,2020) and the holdings in IEFA and XEF (2649 and 2637, respectively). Also the MSCI EM IMI has 3090 holdings whereas IEMG which XEC holds has 2511 Holdings. Do you know of the reason why there is this difference?
VIU and VEE/VWO have essentially same number of holdings as their benchmarks.
Thanks so much!
@Sumeer: To reduce trading costs, BlackRock uses a sampling strategy with IEFA/XEF and IEMG/XEC (i.e. they don’t hold every single stock in the index). As the stocks they exclude are generally smaller, less liquid securities, their sampling strategy would not be expected to have a noticeable impact on performance (as these ETFs are market-cap weighted, meaning that bigger companies take up most of the weight in the fund, and therefore are the main drivers of fund performance).
@Justin: Do you think Vanguard & iShares will ever change VEE & XEC or create new ETFs that will hold underlying stocks directly like VIU/XEF? Thanks, Que
@Que – Possibly some day. BMO’s ZEM has this structure, but it has suffered from considerable index tracking error, due to the strategy.
Hello Justin,
I would like your opinion on the combination of ZEA, ZEM vs. XEF, XEC in terms of performance and uncovered withholding taxes in TFSA and RRSP accounts. Is it a draw between them or is there an advantage to holding one or the other?
Thank you.
@Jean-Louis Bui: I am sticking with the XEF/XEC combo for now. I’ll be discussing this topic in more detail on the launch of my Canadian Portfolio Manager Podcast.
Hey Justin,
Will you be addressing this soon? I listened to your inaugural podcast and there was no mention of why you prefer XEF/XEC over others from what I could hear.
@Kyle: I ended up switching the theme of the first podcast, so this wasn’t addressed. I may revisit it in a future podcast.
Long story short, foreign withholding taxes are lower on ZEM, but it’s sampling has caused underperformance relative to its index. This has resulted in no noticeable after-tax outperformance, relative to XEC.
Hi Justin, thanks for the great info. I read this post when it came out and needed to think about it’s application. I have VEE and XEF. I now understand the gap I’ve created. Would you recommend selling VEE (tfsa) 50k to be replaced with XEC or just add XEC in the future? I can foresee the same problem in the future if I undertake tax loss selling with XEF and replace with VIU. Is it worth the cost to change, (bid/ask) $9.99 commission? It’s only 5% of our portfolio and I am in accumulation mode.
Thanks
Hi Justin – I noticed in your model portfolios that weightings within the foreign equity segment change from month to month, I assume due to changing market caps. If I’m following one of your 5 ETF portfolios, would you recommend I adjust the ITOT / IEFA / IEMG weightings each time I rebalance to match current market caps, or pick a set of weightings and just stick with it?
@Robin: Great question. If you’re targeting similar global market cap exposure as XAW (using ITOT/IEFA/IEMG), you could use new cash flows to rebalance according to the updated model portfolios (this is really just an estimate, as the market caps would have already changed slightly by the time I post the monthly report).
Picking a set of static weightings is perfectly fine as well. We do this with our PWL portfolios.
Is there an ETF that combines VIU+VEE or XEF+XEC in the right proportions, to avoid a commission fee? I’m trying to avoid the XUU portion of XAW.
@John: Not that I am aware of. Is there a reason you’re trying to avoid XUU?
I currently hold VCN, XAW and ZDB in a non-registered account (through TD webbroker). It’s now tax season and I am wondering whether I am supposed to receive a T3 or something like that in the mail for each of these ETFs? I don’t see it online? If someone can point me in the right direction, that would be great!
(and now I also gotta check whether XAW holds Korean stocks or not!)
@SD: You should have likely received your T3 slips for VCN, XAW and ZDB by now (it’s possible that TD is a bit behind with mailings or with uploading the information) – you could always give TD a call just to verify.
XAW holds XEF and IEMG (using a market cap weighting, like in this video), so you would automatically have the “correct” market cap exposure to Korean stocks.
Justin
This is an excellent read. Thank you for all the information. I am impressed with the return of MAW120 global equity fund. What would be your recommendation if I wanted to replicate the %allocations according to MAW120?
@Vaibhav Patel: MAW120 is an actively managed fund (so its country weightings are subject to the active managers’ decisions, not on the market cap weighting of any particular index).
From a tax withholding perspective, which is best to hold these funds in a tax free account or a RRSP?
@Brad: From a purely foreign withholding tax perspective, US-listed and Canadian-listed international equity ETFs have similar tax implications in RRSPs and TFSAs. US-listed emerging markets equity ETFs are more tax-efficient than Canadian-listed emerging markets equity ETFs in an RRSP.
Please feel free to download the Foreign Withholding Tax Calculator on my site, which easily answers all of these questions:
https://canadianportfoliomanagerblog.com/calculators/
Hi Justin,
I first just wanted to say thank you for your amazing work and helping DIY investors understand and appreciate the world of investing. As someone who did not know what an ETF was 1 year ago I can certainly say your website has been a game changer for me as a young investor.
I wanted to get your opinion on USD International ETFs such as VXUS (which I would balance with VTI for US exposure) for a USD RRSP. Your counterpart Dan Bortolotti wrote about VXUS in 2011 (https://canadiancouchpotato.com/2011/02/07/under-the-hood-vanguard-total-international-stock-vxus/). I anticipate better USD International ETFs have come out since then but I can’t seem to find these. Are there better options/alternatives I’m missing? Thanks again for all your insight and expertise!
@Elaine: I’m so glad the blog has helped you become a more informed investor – thank you for the feedback :)
I’m working on a video series that discusses global equity ETF options that you should find helpful. In Part III of the series, I discuss the U.S.-listed Vanguard Total World Stock ETF (VT), which is basically a combination of VTI and VXUS in a single fund. VT has an MER of 0.09%, which is slightly more than the weighted-average MER of VTI/VXUS.
https://advisors.vanguard.com/web/c1/fas-investmentproducts/3141?source=autosuggest&fromSearch=true
If you’re just looking for international/emerging markets exposure (without U.S.), VXUS is still appropriate. The iShares Core MSCI Total International Stock ETF (IXUS) is also another low-cost option.
https://www.blackrock.com/us/financial-professionals/products/244048/
Hello Justin, Thanks for another great article. Can you please add a comment about buying Horizon fund ETFs which are swaps. They have one for international market which looks like Global developed market ETF. I am more interested especially considering that we do not have to pay regular taxes . Only when we sell them as capital gains.
@Hemant: Please refer to my response to you earlier.
Do you know why there’s no plain vanilla EM ETF in Canada that directly holds EM stocks? I only know of ZEM that does this, but lately they’ve been weighting heavily on US listed iShares (30%). Even RBC’s REEM was shut down recently that was a 1,000 company index. Is it just too expensive for Canadian providers to hold EM directly? Or do they think the market isn’t.there. I know there are multifactor like Desjardins that do direct holding so it doesn’t seem like a cost thing to me. I hold ZEM and VIU so I’m annoyed I can’t get VWO as a direct hold like VIU was because of VDU.
@Solar: I’m not certain (it usually has to do with what the market makers are comfortable holding). ZEM is probably the best option at this time (hopefully the other ETF companies will improve their existing products).
Thanks. Yes hopefully they will soon. IMO it’s weird we have to go through the US to access this section of the global market.
ZEM is only at 15.5% iShares holdings – maybe they’re moving in the direction you want!
@Ian: Excellent…my diabolical plan is falling into place… ;)
Love this! Thank you so much for enlightening me. Your posts are always like Christmas in (insert month of post).
Hello Justin, Thanks again for another excellent review. Speaking about international market, would it be better to invest in Horizon developed market equity index which appears similar to FTSE and MSCI indexes. I know that total MER +swap fee adds upto 0.55% but we do not have to worry about witholding taxes and tax on distributions.
@Hemant: That’s likely not a great long-term strategy, as these tax-efficient ETF structures may be shut down by the government in the near future:
https://www.horizonsetfs.com/news/Press-Release/Horizons-ETFs-Assessing-Impact-of-Proposed-Federal