No matter how much evidence piles up in favour of passive investing, the active vs. passive debate just won’t die. Like the undead zombies from your favourite horror flick, the debate springs back to life, hungry for more brains to consume.
But fear not – in this video, I’m determined to put this debate to rest for good.
In our last video, we presented the academic theory behind active vs. passive investing. On average, active investors must own each stock in the same proportion as the total stock market. So, it stands to reason: As a group, active investors must earn the return of the stock market, minus costs. The conclusion is a no-brainer: After costs, the group must underperform the market. The same can be said for passive investors as a group, but since their costs are lower, passive investing prevails in the end.
The logic is damning. Then again, theory isn’t reality. If the higher costs of active management do in fact lead to underperformance, we should see this in active investors’ track record as a group. Today, we’ll examine the evidence to see if active management has actually been performing as poorly as theory would suggest.
Practically speaking, it’s impossible to quantify exactly how many active investors are winning or losing against the market. You’d need the performance data for every actively managed mutual fund, hedge fund manager, pension fund, endowment fund, day trader, retail investor, and so on. Instead, most analyses focus on the actively managed mutual fund industry as a proxy. The data is easy enough to access, and it’s a large enough sample to generate statistically significant results.
Keeping Score with the SPIVA Canada Scorecard
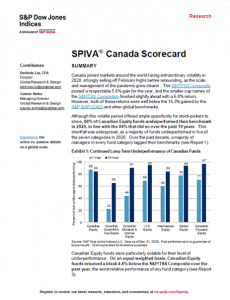
By far, the Standard & Poor’s Indices Versus Active Scorecard—or SPIVA® to its friends—is the best-known, ongoing report for tracking active vs. passive investment results. The S&P Dow Jones Indices produces its SPIVA® Scorecard semiannually, comparing actively managed funds’ after-cost performances against their most appropriate S&P Dow Jones passive indices.
Accounting for Survivorship Bias
The SPIVA® Scorecard also accounts for something called survivorship bias. Often, underperforming funds are liquidated or merged with other funds over time to make the fund company’s worst performers magically disappear. This can create a bias in favour of the active funds, as any remaining winners now make up a higher percentage of a smaller base of surviving funds. And it’s not just a few funds that don’t make the cut. As of December 31, 2020, 54% of all funds in their eligible universe 10 years prior had since been liquidated or merged. That’s more than half of them!
As an example, 70 Canadian equity funds existed on December 31, 2010. A decade later, by year-end 2020, only 38 funds remained. Of those 38 funds, 11 of them were winners, outperforming their index, while 27 of them were losers. In percentage terms, 71.05% of the surviving actively managed funds underperformed the index.
But this figure doesn’t penalize the 32 actively managed funds that were merged or liquidated out of existence during this period, most likely due to their poor performance. Mutual fund companies don’t generally scrap winning funds from their product line-up.
If we combine these 32 funds that didn’t survive with the 27 funds that did survive, but underperformed the index, we now have 59 underperforming funds out of a total of 70, or 84.29%. This figure is noticeably higher than the uncorrected 71.05% figure, which didn’t adjust for survivorship bias.

Source: S&P Dow Jones SPIVA Canada Scorecard as of December 31, 2020
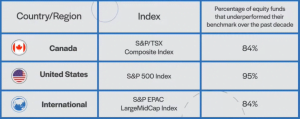
Now back to the results of the SPIVA Canada Scorecard. Over the past 10 years ending December 31, 2020, 84% of actively managed Canadian equity and international equity funds failed to outperform the S&P/TSX Composite Index and the S&P Europe, Pacific, and Asia (EPAC) LargeMidCap Index, respectively. Even worse, 95% of actively managed U.S. equity funds couldn’t beat the mighty S&P 500 Index.
Source: S&P Dow Jones SPIVA Canada Scorecard as of December 31, 2020
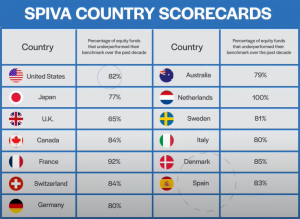
But what if Canadian fund managers are just less skilled than active managers in other countries? Fortunately for us, the SPIVA methodology has also been applied around the world, and the results are relatively consistent across the board. The message is clear: Most actively managed funds don’t beat the returns of their passive benchmark index.
Sources: S&P Dow Jones SPIVA Scorecards as of December 31, 2020
Vanguard Research: The Case for Low-Cost Index-Fund Investing
Vanguard periodically releases a report called “The case for low-cost index-fund investing”. Like the SPIVA® Canada Scorecard, the report showcases the high likelihood of active managers underperforming a comparable index after fees. Vanguard also accounts for survivorship bias in their results, so funds that are shut down or merged with other funds are still included in the results.
According to Vanguard’s report, how did active managers fare over the past decade?
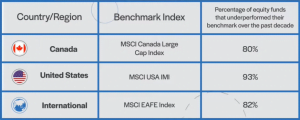
Well, as of December 31, 2020, 80% of Canadian large-cap equity funds underperformed Vanguard’s chosen benchmark, the MSCI Canada Large Cap Index. U.S. equity funds were even worse, with 93% of them underperforming the MSCI USA Investable Market Index over the same period. And on the international front, 82% of equity funds failed to beat the returns of the MSCI EAFE Index.
Source: Vanguard Canada as of December 31, 2020
Morningstar’s Active/Passive Barometer
So far, we’ve pointed to reports that pair actively managed fund performance to comparable indexes. Perhaps that’s not entirely fair. Passive investors also incur fund costs, so it might make more sense to compare the net performance of actively managed funds to their passively managed counterparts. After fees, which approach has come out ahead?
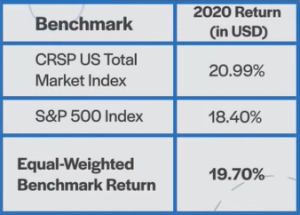
This is exactly what Morningstar has been doing with its semi-annual Active/Passive Barometer report. For example, instead of using the S&P 500 or a similar index as the benchmark for large-cap U.S. equity funds, they have created a composite of index funds and ETFs with similar strategies, like the Vanguard Total Stock Market Index Fund (VTSAX), the SPDR S&P 500 ETF Trust (SPY), and so on. They then calculate an equal-weighted average return for this passive group, which becomes the hurdle rate for an active manager to beat.
Morningstar’s methodology also ensures they’re not cherry-picking a single index, which could skew the results in favour of passive investing. For example, the number of market-beating U.S. equity funds can vary in any given year depending on whether you compare their performance to the CRSP US Total Market Index or the S&P 500 Index. The playing field is more even if you compare them to a composite of both.
Source: Morningstar Direct
Morningstar’s report is also extensive. Its 2020 analysis included nearly 4,400 funds representing approximately $15.9 trillion USD in assets. That’s roughly two-thirds of the U.S. mutual fund market. And like the other reports, Morningstar corrects for survivorship bias by including all funds that existed at the beginning of each measurement period.
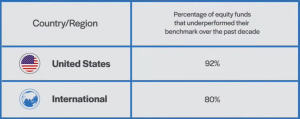
Even after including the average costs for the passively managed alternatives, Morningstar’s Active/Passive Barometer still paints a similar picture to the SPIVA Scorecard and Vanguard’s research: Most actively managed funds failed to beat their benchmarks. Only 23% of all active funds were able to exceed the returns of their average passive rivals over the 10-year period ending December 31, 2020. Specifically, 92% of U.S. large-cap funds and 80% of international large-cap funds underperformed their passive counterparts over this period.
Source: Morningstar’s Active/Passive Barometer as of December 31, 2020
In Theory and Practice, Passive Beats Active
So, there you have it. Just as academic theory suggested some 30 years ago, the overwhelming majority of actively managed funds have been underperforming passively managed indexes and funds for years. The reason why has not changed, so we don’t expect the outcomes to change either. For most investors, the best approach remains the same: Embrace a low-cost passive strategy, and ignore the allure of more expensive actively managed strategies. Their promises are premised on hope rather than reason.
Still, you may hesitate. Sure, on average, actively managed funds underperform. But there are always some that succeed. Why not invest in them? In our next video, we’ll examine just how difficult it is to pick those winning actively managed funds in advance. See you then!


Interesting reading. looking forward to see how actively managed funds perform before the year runs out. Great thanks Justin.
It’s going to be interesting to watch the % of funds which underferformed their benchmark this year.
This video/blog concludes by saying that the next episode will examine just how difficult it is to pick in advance the “winning” actively managed funds. I’m still waiting!!!! When do you expect to post it?? Thanks
@ockham – I’ll be circling back around to finish off this topic in the new year (I got a bit side-tracked with the latest series).
Thx. I was worried I’d missed it! The third episode remains necessary. It’s needed to nail the coffin shut once and for all on the conceit that there’s value in the search for the “winning” manager(s).
My apologies. Left a comment on an entirely different article…I was examining tax-loss harvesting. I’ll re-ask in the youtube video I viewed.
Does it get to a point where selling and buying a large number of units become too unwieldy? Your video example uses $100,000 that can be let go and repurchased immediately (on the day of). Does a holding of a single ETF become too big at some point to be able to let go and its paired ETF purchased in a large lot?
Hi Justin,
hope all is well.
I was wondering if you could talk about dividend etfs especially the one with covered call strategy, what are the pros and cons,
BMO has some, so does harvest group, like HDIF with 9+% YIELD.
as always thank you for your time and effort.
@Vince
I’m not sure I would characterize the ‘Couch Potato’ approach as one that advocates ‘buying the dip’ so much as one that advocates ‘making a plan and staying the course’. ‘Buying the dip’ is an attempt to market time and is not advocated by the ‘potato guys’. Just by staying the course some investments are made at the bottom of the dip but the bottom was only determined in hindsight and was not part of the decision to invest. There is ample data showing that over longer periods— like 20 years— the stock market has been the best performing asset class and so that figures into the rationale/logic of their stock/bond allocation. And yah, I agree, it kinda sucks that the markets are down.
The invention of a time machine will prove you wrong.
@Bob – Sure…thanks.
Hi Justin,
I understand that all the advice you give to your personally managed clients is likely specific to each account – just curious what you do in situations like today, where we are seeing significant decreases in both equities and bonds (as interests rates increase.)
Over the majority of your managed accounts would you say you do:
1. Stay the course and continue to invest monthly contributions (dollar cost averaging during a downturn) in the same portfolio mix?
2. Rebalance or adjust your portfolio and take advantage of higher bond yields?
3. Sell and crystalize the capital losses and invest in a similar but not equal index fund (I’m an avid podcast listener :)….just have never sold to crystalize a loss in my corporate unregistered account before)?
4. Hold any new investment cash and try to time the bottom (I know you can’t predict the future and this is a big no-no from any of your podcasts, but I’m sure you can analyze the market conditions and estimate much better than us, so I’m curious if you do time the market to an extent.)
Thanks again for all you do!
@Billy – Our clients’ portfolios are all at different stages in their investment life (i.e., some clients have been with us for many years, so there aren’t many tax-loss selling opportunities, while others were just invested, so many opportunities are presenting themselves). To briefly answer your questions:
1. Yes, definitely staying the course and sticking to the original investment plans.
2. Some rebalancing, but with bonds also in the red this year, most portfolios are still reasonably on target.
3. A lot of tax-loss selling, especially with bond ETFs (i.e., switching ZDB to XBB).
4. I’m pretty good with an excel spreadsheet, but that can’t help me predict the future. If investors have a solid investment plan that they’re comfortable with, they should be investing their cash (as long as they already have an emergency fund).
Hi Justin,
What is the rationale behind switching from ZDB to XBB?
Thanks,
Alan
@Alan – It’s a tax-loss selling trade (realizing losses by selling ZDB, while maintaining similar Canadian bond market exposure by immediately buying XBB with the sale proceeds):
Tax-Loss Selling with ETFs (video):
https://www.youtube.com/watch?v=crVOQPVc-rk
Hi Justin,
For our corporate account, if our capital dividend account is at $0.00, but our ZDB or other etfs are down 10% and $10,000, is it more prudent to just hold them until we have a positive balance in our cda account, even if that could be a long way off, or is it more prudent to just sell these now and not worry about the cda account becoming negative? Which one is more important to consider in this situation??
Hi Justin,
Just wanted to confirm that in your opinion, it isn’t possible to predict how far the market may slide? I’m sure you have seen how stock markets have dropped this last 6 months, along with crypto (which I don’t personally own, but like to keep an eye on out of interest).
I understand Robb Engen is invested in 100% VEQT so I assume he is holding throughout the slides but would appreciate your opinion. It is generally suggested that market ups and downs, even now, cannot be predicted or expected to any degree at all? Despite the fear and general changes with interest rates, inflation, etc lately?
Kinda sucks that the average person’s return in the last year and a half hasn’t accounted for much when it comes to inflation negating those returns. :(
Thank you!
@Vince – I can confirm that no human can predict the future, or predict how far the market may slide (they can certainly guess, and sometimes they’ll be right, but they have no supernatural abilities).
I’m slightly confused by the logic regarding investing, although I do understand it to a certain extent. Investing in diversified funds frequently without timing the market is recommended due to stock market value generally increasing overall each year. As far as I’m aware, general recommendations suggest to invest during market downturns as the belief is that the market will likely recover (although it is generally acknowledged that it is possible that it won’t). Isn’t the general advice that the market will recover during a downtown a form of ‘predicting the future’? How come similar logic can’t be applied in the reverse direction?
Thank you Justin!
@Vince – There’s always a possibility that any stock market (or the global stock market) won’t recover over a long-term investment timeframe, like 20 years (it’s a risk of investing in stock markets, even though it is unlikely to occur). If this scenario concerns you, you likely need more stable fixed income investments (like GICs) in your portfolio.
Oh no, I understand there is a possibility the stock market / global stock market won’t recover over a long period of time. And it doesn’t concern me really as there would likely be other issues with society at that point if it did happen that my investments likely would not mean anything at that point. I meant to say that I don’t completely follow the logic of “the stock market can’t be predicted with any level of accuracy”, but sound advice also seems to consist of “the stock market generally recovers from crashes, so buying dips is ideal”. The latter part of that seems to be somewhat predicting the recovery of the stock market over the long term. So I wonder how it’s possible to say that nobody can predict / guess how far a stock market may slide during a crash / dip / recession, but that buying when the stock market crashes is great since the stock market usually recovers (which is what Hallam said specifically in his book Millionaire Teacher, as he called it getting index funds ‘at a discount’), which seems to be ‘predicting the future’ of the stock market.
If the market’s long-term recovery is generally assumed or predicted based on history (while acknowledging that it is POSSIBLE that it might not, though unlikely), how can that live in co-dependence with ‘the stock market ups and downs cannot be predicted with any reliable accuracy’? I hope that question made sense. I am still personally invested in the ways that have been recommended to me by you, Dan, Robb, and Andrew, but don’t really follow the logic of ‘stock market futures cannot be predicted, but the market generally recovers in the long-term after a crash’. X_X
@Vince – To invest in the stock markets, you need to understand that you are really investing in businesses. And if you think those businesses will do whatever it takes to make more money for their shareholders, then it’s reasonable to conclude that stock markets (over the very long-term) are expected to make more money for their investors. However, we can all imagine scenarios where this might not occur (i.e., a global pandemic that killed billions of us instead of millions, escalating global nuclear war, etc.).
Hi Vince, I can confirm that I’m still holding VEQT across all accounts (just like I was in March 2020 when it went down 34%).
I look at it this way: I expect VEQT to average a 6-8% return over the very long term. The range of outcomes in any given year, however, can be quite broad. From -37.5% in 1973-74 according to Justin’s backtest, to…I don’t know, maybe +30% in a fantastic year.
VEQT’s return in 2020 was 11.29% and in 2021 was 19.66%. Again, according to Justin’s backtested results, the 10-year annualized return for VEQT would have been 12.66% as of Dec 2021 if VEQT had been around that long.
Okay, so if expected global stock returns are between 6-8% on average over the very long term, and the previous 10-year returns averaged 12.66%, that should tell us to expect lower returns over potentially the next decade. We should also expect a negative year from time-to-time. We shouldn’t expect global stocks to continue posting double-digit returns every single year.
I don’t see that as crystal ball gazing or as making predictions. It’s just being realistic with expectations.
Finally, if you told me in mid-February 2020 that a global pandemic was going to shut down the world for ~2 years, and you forced me to guess where stocks would be 27 months later I think any reasonable person would say stocks would be lower today. But here we are and VEQT’s price is up 7.17% over that time.