Investment performance has always been a touchy subject for the financial industry. Portfolio rates of return are rarely disclosed, and investors are often left in the dark on how they are actually doing. Phase II of the Client Relationship Model (CRM II) is about to change all of that. Starting in July 2016, dealers and portfolio advisors will be required to provide performance reports to their clients every year.
The money-weighted rate of return (MWRR) was chosen by the Canadian Securities Administrators (CSA) as the industry standard for these performance calculations. Their rationale was that the money-weighted rate of return was more relevant to the individual investor. Other industry groups, such as the Portfolio Management Association of Canada (PMAC), requested that the CSA reconsider their decision, and instead allow dealers and portfolio advisors to use either the money-weighted or the time-weighted rate of return (TWRR). They argued that the time-weighted rate of return was a more appropriate method, as it allowed investors to directly compare their performance to suitable benchmarks and to other advisors and portfolio managers.
To better understand both sides of this debate, let’s look at a hypothetical investor who receives performance reporting using the money-weighted rate of return, but then attempts to compare it to an appropriate index return.
Money-Weighted Rate of Return Example
At the end of 2003, an investor contributes $100,000 to a Canadian stock portfolio managed by an advisor. After four years of stellar returns, the investor decides to place an additional $100,000 under their management. The financial crisis quickly unfolds, and the investor ends 2008 with only $189,600 (wiping out all previous gains and leaving them with less than their total investment).
Example: Transaction history for hypothetical investor
| Date/Period | Transaction | Portfolio Value | Cumulative Gain/Loss |
| Dec 31, 2003 | $100,000 initial investment | $100,000 | $0 |
| Jan 1, 2004 – Dec 31, 2004 | 13% market gain | $113,000 | $13,000 |
| Jan 1, 2005 – Dec 31, 2005 | 27% market gain | $143,500 | $43,500 |
| Jan 1, 2006 – Dec 31, 2006 | 17% market gain | $167,900 | $67,900 |
| Jan 1, 2007 – Dec 31, 2007 | 9% market gain | $183,000 | $83,000 |
| Dec 31, 2007 | $100,000 contribution | $283,000 | $83,000 |
| Jan 1, 2008 – Dec 31, 2008 | 33% market loss | $189,600 | ($10,400) |
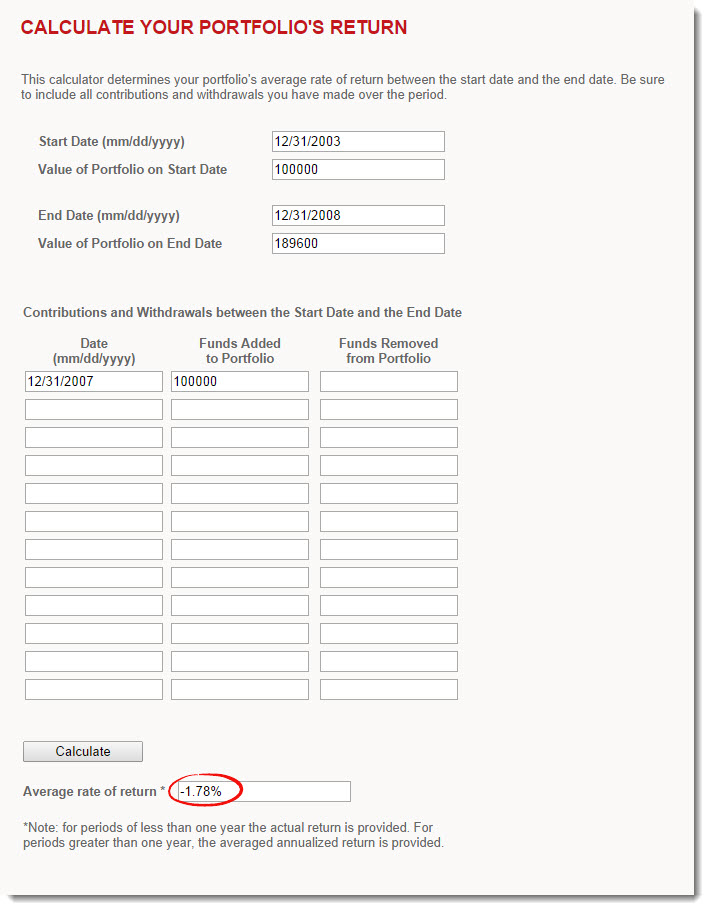
Shortly after year-end, the investor receives a performance report from their advisor, indicating that their 5-year annualized money-weighted rate of return is -1.78%1. They are not surprised by this figure, but decide to compare it to a suitable benchmark, the S&P/TSX Composite Index. To their horror, they find that over the exact same period, the index returned 4.15% on an annualized basis.
If we recalculate the investor’s return using the time-weighted rate of return method, we end up with a 5-year annualized return of 4.16%2 (almost identical to the benchmark return). But how can that be? The investor has clearly lost money – they are down $10,400.
The reason for this is because the money-weighted rate of return is more dependent on when the dollars are actually contributed or withdrawn from the portfolio. In the example above, the investor doubled the amount they had initially contributed right before the market declined, resulting in a lower return relative to the time-weighted rate of return. The results of this method often make more sense for the investor, as it is a better representation of how they have actually done.
The time-weighted rate of return ignores all contributions and withdrawals from the portfolio. In the example above, the investor’s bad luck or timing had no effect on their return. The calculation basically assumes that they invested $1 at the beginning of the period (with no further contributions or withdrawals). This method is ideal for comparing managers or funds to benchmark indices.
The CSA has stood firm on their decision, so it is up to advisors to familiarize themselves with both methods so they can explain them to their clients. In order to help with this task, I’ve posted several rate of return calculators (in the Calculators section of the blog) that use the Modified Dietz method (an approximate time-weighted rate of return). This will allow advisors and clients to calculate a more appropriate return for benchmarking purposes.
1 MWRR =
Source: Weigh House Investor Services: Calculate Your Portfolio’s Return
2 TWRR = [(1 + 0.13) × (1 + 0.27) × (1 + 0.17) × (1 + 0.09) × (1 + (-0.33))](1/5) – 1 = 4.16%


Hi, many thanks. One question: if there is a portfolio with an equities part and a private equity part, and I decide that it is best to use time weighted returns for the equities and MWRR for the private equities investments, can I directly compare these two? i.e.: if equities did 9% (TWRR) over the period and the PEs performed 15% (MWRR), can I say that the PEs performed better than the equities and put these numbers directly in comparison in a table? Or to compare should we use the same method of calculation for both (TWRR or MWRR, but not both mixed) ? It seems to me that we can compare these two directly since in the end they simply express the same thing (performance as a percentage) using whichever method is most appropriate for a given investment or portfolio…
Also, if they are directly comparable, then can we use both to calculate the performance of the total portfolio? For example, if equities returned 9% (TWRR) and represented 50% of the portfolio and PEs returned 15% (MWRR) and represented the other 50%, can one say for example that the portfolio return is approx. 12% ? (7.5% + 4.5%)
Many thanks.
@Derek O’Sullivan: Benchmarking private equity returns is tricky – for some possible solutions to your problem, please refer to this post: https://blogs.cfainstitute.org/investor/2014/07/23/evaluating-private-equity-performance-pme-vs-direct-alpha/
Thanks for this explanation. I have always used the MWRR but can see how the TMRR might be useful also for a portfolio manager to benchmark against another fund or an index. I calculated my annual RR using both methods. If my MWRR was greater than my TWRR does this mean that my portfolio rate of return was enhanced by good timing (or luck) as to when capital was added to the portfolio? Conversely, as in your example, if the MWRR is less than the TWRR then an investor made bad decisions (or just bad luck) as to when to add money to the portfolio?
@KayT – you got it! It’s most likely a case of good/bad luck or timing if the MWRR is above/below the TWRR.
First, thanks for starting this blog. PWL’s Research Department is always one of my first stops.
But now about this blog post, you forgot to show the MWRR formula!!!
@schultzter – I’m glad you’ve enjoyed our research. Thank you for letting me know about the missing image – it has now been updated (I used the Weigh House rate of return calculator for the MWRR in the example, but you can also calculate this using Excel).